Gold Price Forecast: XAU/USD defends $2,900 as focus shifts to top-tier US data
- Gold price pauses the two-day uptrend while defending the $2,900 level early Wednesday.
- Rebounding US Treasury bond yields and Trump’s Congressional address lift the US Dollar.
- Gold price recaptures 21-day SMA at $2,903 as the daily technical setup still leans bullish.

Gold price is holding the fort above the $2,900 threshold early Wednesday, snapping its two-day upswing from three-week troughs of $2,833. Gold traders look forward to the fresh developments surrounding US President Donald Trump’s latest tariffs implementation and the US ADP Employment Change data for fresh directives.
Gold price pulls back before the next leg up
Gold price has returned to the red so far this Wednesday, replicating the moves seen in Asian trading on Tuesday. The renewed weakness in the Gold price is mainly driven by the recent turnaround in the US Treasury bond yields across the board, which has helped lift the sentiment around the US dollar (USD).
US Treasury yields paused their run of declines and staged an impressive bounce, taking the lead from German yields amid a steep fall in Germany’s government bonds after the Conservatives and Social Democrats announced proposals to set up a EUR500 billion fund for infrastructure and overhaul borrowing rules aimed at increasing defence spending.
The Greenback also receives support from US President Trump’s Congressional address, in which he reiterated that the reciprocal tariffs would take effect from April 2 while re-emphasizing 25% tariffs for aluminum, copper, steel.
However, a further downside in Gold price appears elusive as mounting fears over a potential global trade war lurk after Trump’s 25% tariffs on Canada and Mexico and 10% extra levies on China took effect on Tuesday. All the affected countries responded with retaliatory tariffs, which will likely continue underpinning Gold’s appeal as a traditional safety net and also as a store of value amid expectations of stagflation in the US.
Further, a weak US ADP jobs report could offer a fresh zest to Gold buyers as the data could reinforce US economic slowdown fears and dovish Federal Reserve (Fed) expectations, supporting the non-interest-bearing bright metal.
The US private sector is expected to create 140K jobs in February after reporting a 183K job gain in January. A disappointing US ISM Services PMI data could also render positive for Gold price.
That said, if chatters around the reversal of Trump’s tariffs on Canada and Mexico are realised, Gold price upside could be at risk.
Gold price technical analysis: Daily chart
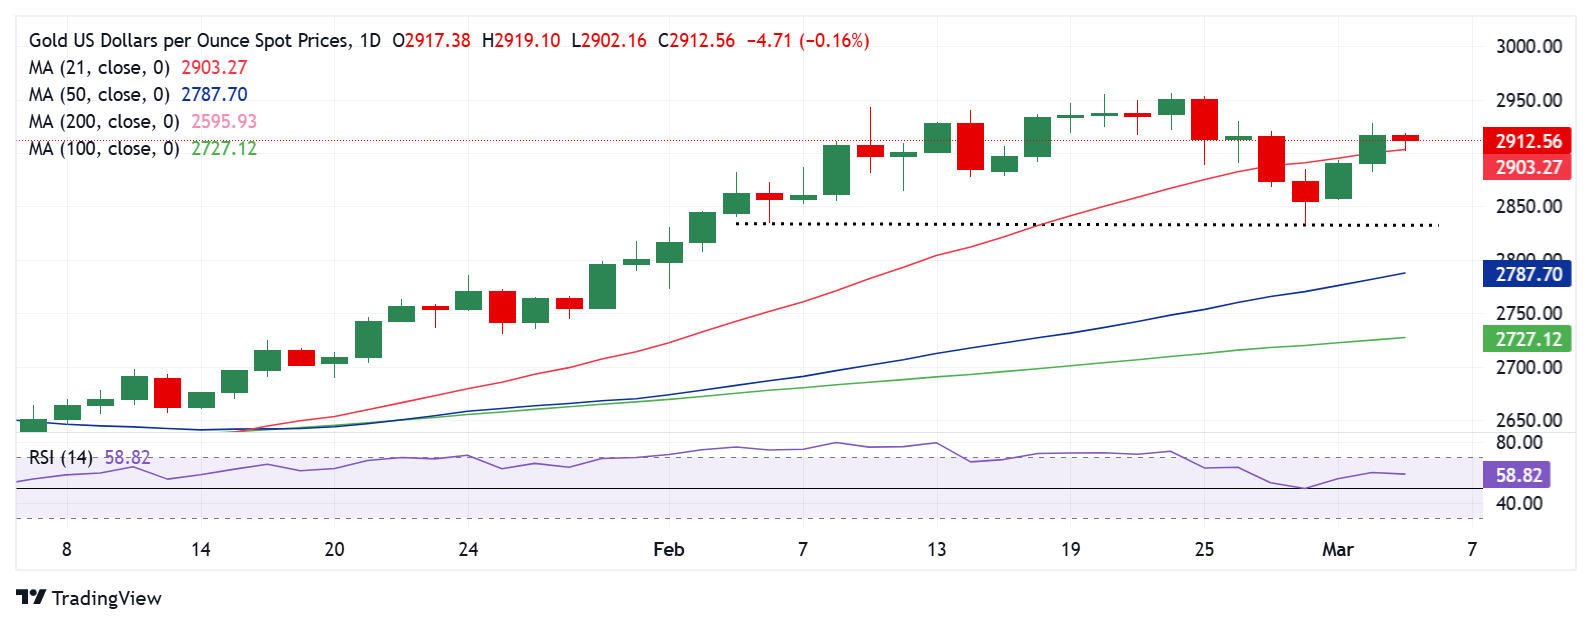
The daily chart shows that Gold price defends the 21-day Simple Moving Average (SMA) of $2,903 despite the latest downtick.
The uptrend could regain traction only on acceptance above the $2,930 static resistance on a daily candlestick closing basis.
The Relative Strength Index (RSI) has turned slightly lower but holds well above the 50 level, suggesting that the bullish potential remains in place.
If the February 26 high of $2,930 is taken out sustainably, the next topside barriers are at an all-time high of $2,956 and the $2,970 round level.
If sellers extend their control, immediate support is seen at the 21-day SMA at $2,903, below which the $2,850 psychological barrier will be challenged.
The $2,835 demand area will then come into play.
Economic Indicator
ADP Employment Change
The ADP Employment Change is a gauge of employment in the private sector released by the largest payroll processor in the US, Automatic Data Processing Inc. It measures the change in the number of people privately employed in the US. Generally speaking, a rise in the indicator has positive implications for consumer spending and is stimulative of economic growth. So a high reading is traditionally seen as bullish for the US Dollar (USD), while a low reading is seen as bearish.
Read more.Next release: Wed Mar 05, 2025 13:15
Frequency: Monthly
Consensus: 140K
Previous: 183K
Source: ADP Research Institute
Traders often consider employment figures from ADP, America’s largest payrolls provider, report as the harbinger of the Bureau of Labor Statistics release on Nonfarm Payrolls (usually published two days later), because of the correlation between the two. The overlaying of both series is quite high, but on individual months, the discrepancy can be substantial. Another reason FX traders follow this report is the same as with the NFP – a persistent vigorous growth in employment figures increases inflationary pressures, and with it, the likelihood that the Fed will raise interest rates. Actual figures beating consensus tend to be USD bullish.
Premium
You have reached your limit of 3 free articles for this month.
Start your subscription and get access to all our original articles.
Author

Dhwani Mehta
FXStreet
Residing in Mumbai (India), Dhwani is a Senior Analyst and Manager of the Asian session at FXStreet. She has over 10 years of experience in analyzing and covering the global financial markets, with specialization in Forex and commodities markets.


