Gold Price Forecast: XAU/USD could extend slide unless it manages to reclaim $1,700
- XAU/SUD is losing more than 1% for second straight day.
- Technical outlook points to a correction before the next leg down.
- Former $1,700 support now aligns as key resistance.

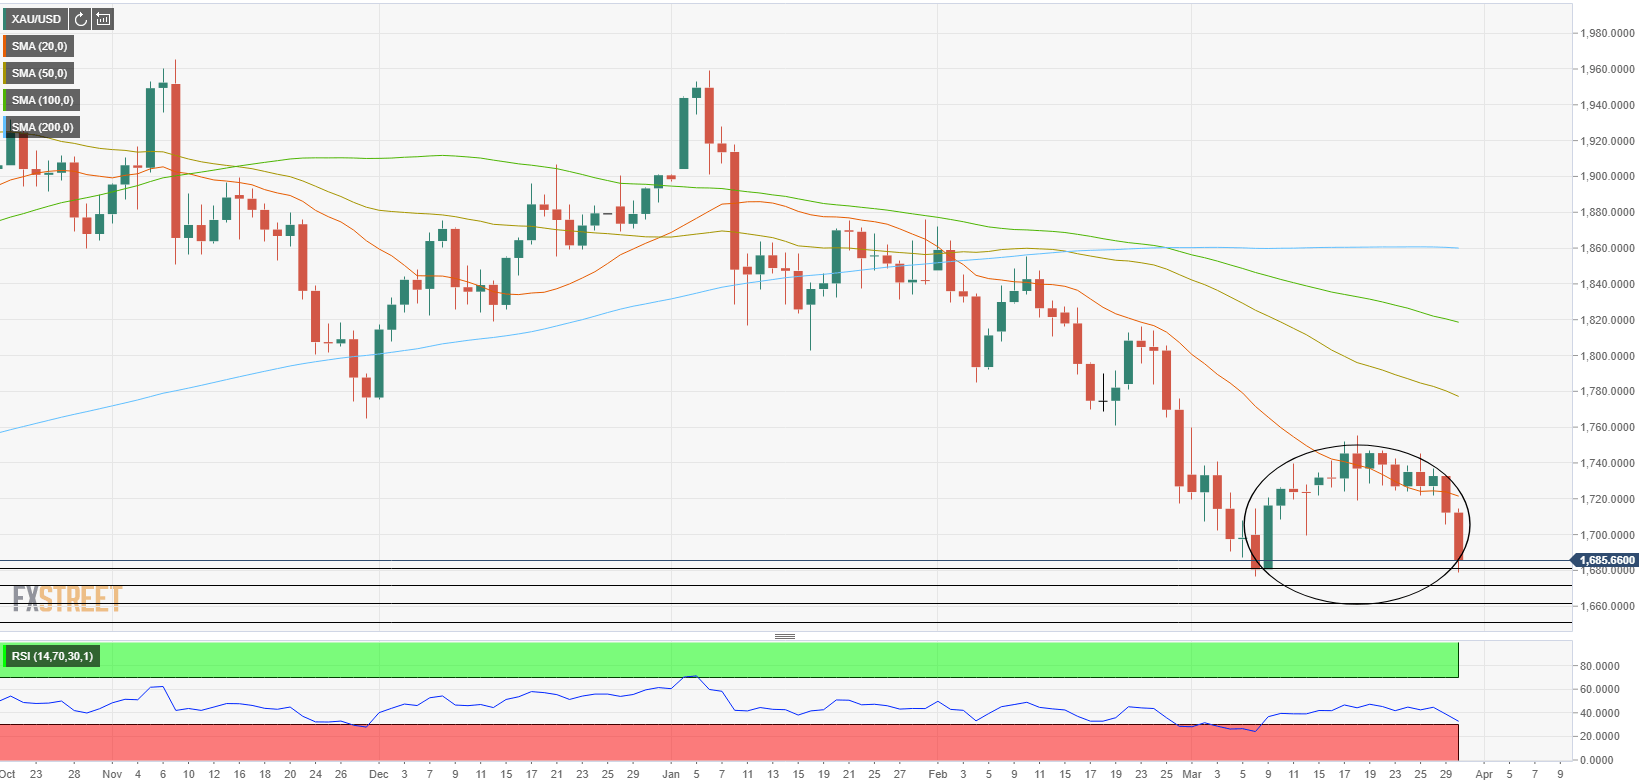
The XAU/USD pair fell sharply after breaking below $1,720 support on Monday and failed to stage a convincing rebound on Tuesday. With sellers remaining in control of the action, gold extended its slide to a fresh three-week low of $1,678. Currently, XAU/USD is trading at $1,685, losing 1.55% on a daily basis.
The strong upsurge witnessed in the US Treasury bond yields weighed heavily on gold on Tuesday. The benchmark 10-year US T-bond yield, which posted gains in the previous three trading days, touched its highest level in more than a year at 1.774% on Tuesday and was last seen rising 2.2% on the day at 1.753%. 1.75% is widely seen as a key level for the 10-year US T-bond yield and a daily close above this point could allow the bullish momentum to remain intact and make it difficult for XAU/USD to erase its losses.
Meanwhile, the data from the US showed on Tuesday that the Conference Board's Consumer Confidence Index rose to its highest level in a year at 109.7 in March. This reading beat the market expectation of 96.9 by a wide margin but was largely ignored by investors.
Later in the session, Federal Reserve Bank of New York President John Williams will be delivering a speech.
Gold technical outlook
On the daily chart, gold seems to have formed an inverted cup with the price reaching the $1,680 area, the ending point of the Feb. 2-Mar. 8 downtrend. Although an inverted cup is a bearish pattern, a so-called handle needs to be completed via a technical correction before the next leg down. Furthermore, the Relative Strength Index (RSI) indicator on the daily chart is near 30, suggesting that gold is about to become technically oversold.
In case XAU/USD manages to stage a recovery, the initial resistance is located at $1,700 (psychological level) ahead of $1,720 (20-day SMA). As long as $1,700 resistance continues to hold, a bullish shift is unlikely to occur in the near-term.
On the other hand, $1,680 aligns as the first support on the downside. Below that level, a couple of static supports coming from April 2020 could be seen at $1,670 and $1,660.
Author

Eren Sengezer
FXStreet
As an economist at heart, Eren Sengezer specializes in the assessment of the short-term and long-term impacts of macroeconomic data, central bank policies and political developments on financial assets.


