Gold Price Forecast: XAU/USD consolidates around $2,650

XAU/USD Current price: $2,650.45
- The US Dollar maintained its positive traction at the beginning of the week.
- Investors await for Canada and UK inflation updates and the ECB monetary policy decision.
- XAU/USD holds near record highs, but bulls are giving signs of giving up.
Spot Gold is under mild pressure on Monday, trading with modest losses after peaking at $2,666.71 earlier in the day. XAU/USD is stable at around $2,650 a troy ounce, as the positive tone of Wall Street limits the US Dollar (USD) demand. The Greenback, however, started the week with a firm footing amid persistent geopolitical tensions in the Middle East and news coming from China.
The Chinese Finance Minister Lan Fo’an offered a press conference over the weekend, but failed to provide details on additional support to the battered economy, leaving investors with a sour taste in their mouths. Additionally, Chinese data missed expectations, creating doubts about the economic future of the Asian giant.
Other than that, European equities posted modest gains as investors await clearer clues. This week, Canada and the United Kingdom (UK) will publish inflation updates, while the European Central Bank (ECB) will announce its decision on monetary policy next Thursday. In the meantime, Federal Reserve’s (Fed) officials will be on the wires and may or may not provide fresh clues on what the central bank may do next.
XAU/USD short-term technical outlook
From a technical point of view, the daily chart for XAU/USD shows bulls may be a bit exhausted. The pair stands near its recent highs, but the Momentum indicator heads south and is currently crossing its midline into negative territory. The Relative Strength Index (RSI) indicator also turned lower but holds near overbought territory. At the same, the pair is developing above all its moving averages, which maintain moderated bullish slopes. Overall, the risk of a downward extension seems limited, yet bulls seem to have moved to the sidelines.
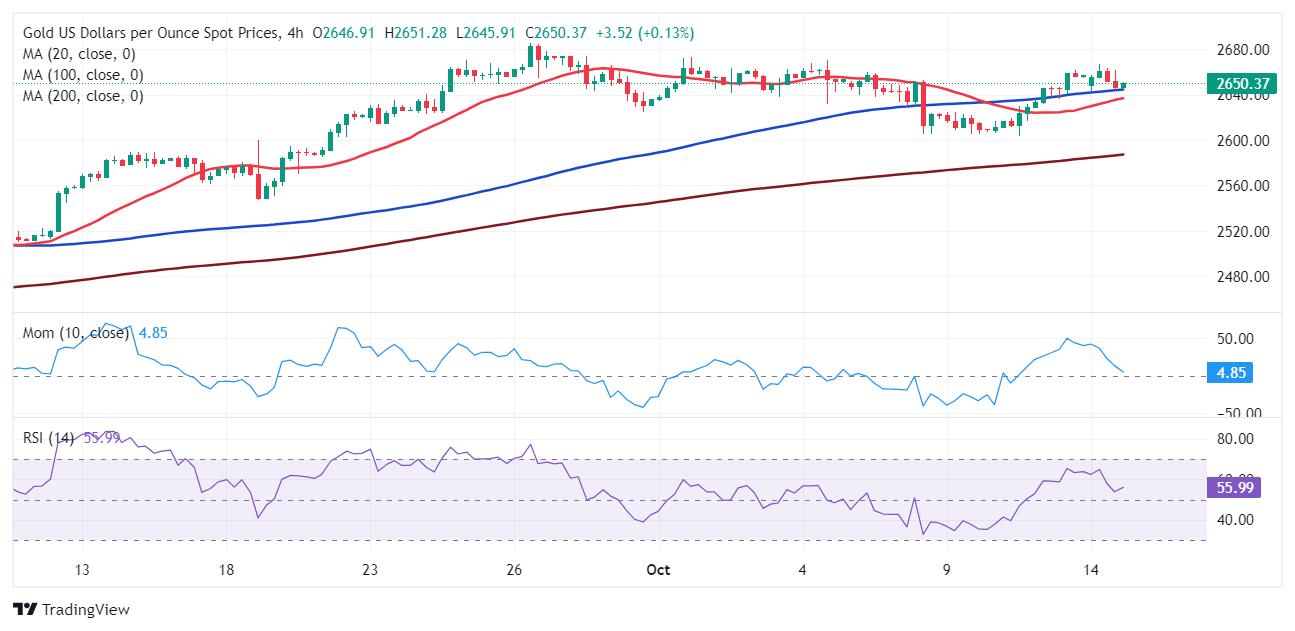
In the near term, and according to the 4-hour chart, the technical picture is quite similar. XAU/USD is finding intraday buyers around a flat 100 Simple Moving Average (SMA) while a mildly bullish 20 SMA advances below the longer one. Technical indicators, on the contrary, turned lower within positive levels, showing uneven bearish strength. The risk of a bearish continuation should increase on a break below the $2,636.00 region, the immediate support area.
Support levels: 2,363.00 2,325.40 2,603.90
Resistance levels: 2,661.20 2,673.10 2,685.45
Premium
You have reached your limit of 3 free articles for this month.
Start your subscription and get access to all our original articles.
Author

Valeria Bednarik
FXStreet
Valeria Bednarik was born and lives in Buenos Aires, Argentina. Her passion for math and numbers pushed her into studying economics in her younger years.


