Gold Price Forecast: XAU/USD confirms Bull Flag, re-attempts $2,000
- Gold price challenges key resistance at $1,988 on its way to $2,000.
- US Dollar extends recovery with the US Treasury bond yields amid risk-aversion.
- Gold price confirmed a Bull Flag on the daily chart, with RSI still pointing to more gains.

Gold price is building on the previous upswing early Thursday, capitalizing on broad risk-aversion, as Middle East tensions grab attention once again. Gold price is paying little heed to the recent upbeat momentum in the US Dollar alongside the US Treasury bond yields.
US Q3 GDP, Middle East strife take centerstage
A typical risk-off market environment was witnessed in the US last session after Wall Stocks tanked on a disappointing US tech earnings report from Google parent Alphabet Inc. The tech giant tumbled nearly 10% after it reported downbeat cloud services revenue, shrugging off strong results from Meta Platforms Inc.
Investors also flocked to safety in Gold price and the US Dollar, as the US Treasury bond yields resumed their upward trajectory, with the benchmark 10-year bond yield closing in on the 5.0% level once again.
Rising borrowing costs continue to weigh on the corporate mood. And therefore, reduced appetite for risk assests remains in vogue in Asia on Thursday. Fresh escalation in tensions on the Hamas-Israel conflict, after Israel Prime Minister Benjamin Netanyahu said late Wednesday that Israel is preparing a ground invasion of Gaza, further tempered investors’ sentiment.
Investors also remain wary of high-beta assets heading into the preliminary release of the US Q3 Gross Domestic Product (GDP) report, which could have a significant influence on the Fed’s policy outlook.
Looking ahead, Middle East tensions will help Gold price stay afloat. However, the US economic data releases could put the market’s focus back on the Fed’s path forward on interest rates. The European Central Bank (ECB) is set to bring a half to its tightening program on Thursday but President Christine Lagarde’s message will hold the key, impacting risk sentiment.
Gold price technical analysis: Daily chart
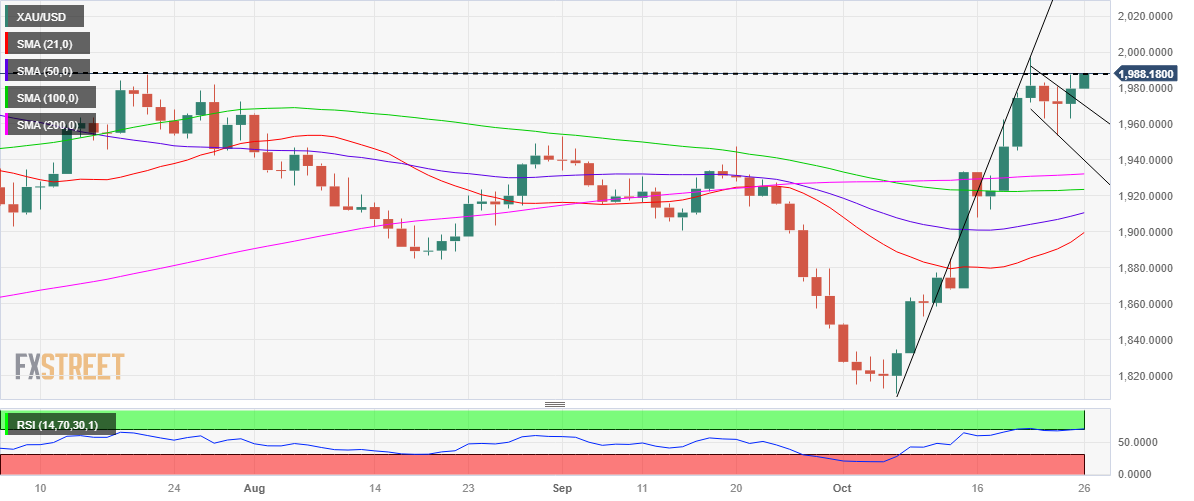
As observed on the daily chart, Gold price confirmed a Bull Flag formation after closing Wednesday above the falling trendline resistance of $1,976.
The 14-day Relative Strength Index (RSI) indicator is teasing the overbought territory, suggesting that there is enough room for the upside.
From a short-term technical perspective, nothing seems to change for Gold price, as it still remains a ‘buy-the-dip’ trade.
The immediate resistance is now seen at the July 20 high of $1,988. Gold buyers will then flex their muscles toward the five-month highs of $1,997 en-route the $2,000 barrier.
On the flip side, if Gold price faces rejection at a higher level, the static support at $1,963 will come into play on the correction. Further south, the $1,950 psychological level will be retested.
Gold sellers will then aim for the October 19 low of $1,945 should the downside accelerate.
Premium
You have reached your limit of 3 free articles for this month.
Start your subscription and get access to all our original articles.
Author

Dhwani Mehta
FXStreet
Residing in Mumbai (India), Dhwani is a Senior Analyst and Manager of the Asian session at FXStreet. She has over 10 years of experience in analyzing and covering the global financial markets, with specialization in Forex and commodities markets.


