Gold Price Forecast: XAU/USD comes up for air, awaits Trump-Xi meeting outcome
- Gold holds the rebound near $3,950 after the Fed decision-induced volatility on Wednesday.
- Less dovish Fed-led US Dollar upswing fizzles out amid US-China trade deal hopes.
- Risks appear skewed to the downside so long as Gold stays below the 21-day SMA and the daily RSI remains bearish.

Gold is once again attempting a bounce above $3,900 as buyers try their luck for the third consecutive day in Asian trading this Thursday.
Gold looks to outcome of the Trump-Xi meeting
Gold remains confined within a familiar range, despite the critical US Federal Reserve (Fed) monetary policy decision-induced volatility seen on Wednesday.
The bright metal briefly regained the $4,000 barrier after the Fed delivered on the expected 25 basis points (bps) interest rate cut.
However, the upswing was quickly reversed as the US Dollar (USD) staged an impressive comeback following Fed Chair Jerome Powell’s commentary during the press conference.
Powell noted that policymakers are likely to become more cautious if it deprives them of further job and inflation reports, per Reuters.
His words tempered bets for another rate cut by the Fed next month, with markets now pricing in a 67.8% probability that the Fed will hold rates at the December 10 meeting, compared with a 9.1% chance seen pre-Fed announcements, the CME Group's FedWatch tool shows.
Early Thursday, Gold buyers have come up for some air after four consecutive days of losses, eagerly awaiting the outcome of the highly anticipated meeting between US President Donald Trump and his Chinese counterpart Xi Jinping in South Korea, that is now underway.
The recent US-China trade talks have signalled a potential deal is in the offing at this meeting, especially after a preliminary consensus on topics including export controls, fentanyl and shipping levies was reached by both sides during their two-day talks in Malaysia.
Failure to reach a trade agreement by the top leaders could send risk sentiment into a tailspin, reviving the safe-haven demand for Gold. On the contrary, if both sides boast about progress toward a trade deal or stike one, Gold could be hammered as risk flows will take over.
In case an outright trade deal is not reached, the specifics of the meetings and details of any progress made would be closely scrutinized by markets.
On Wednesday, President Trump said that he expects to reduce US tariffs on Chinese goods in exchange for Beijing’s commitment to curb exports of fentanyl precursor chemicals.
Another catalyst that could drive Gold moves is the Bank of Japan (BoJ) policy announcements. Any surprises from the BoJ could trigger a sharp volatility in the USD/JPY pair, which could have a significant impact on the USD and the USD-denominated Gold.
Gold price technical analysis: Daily chart
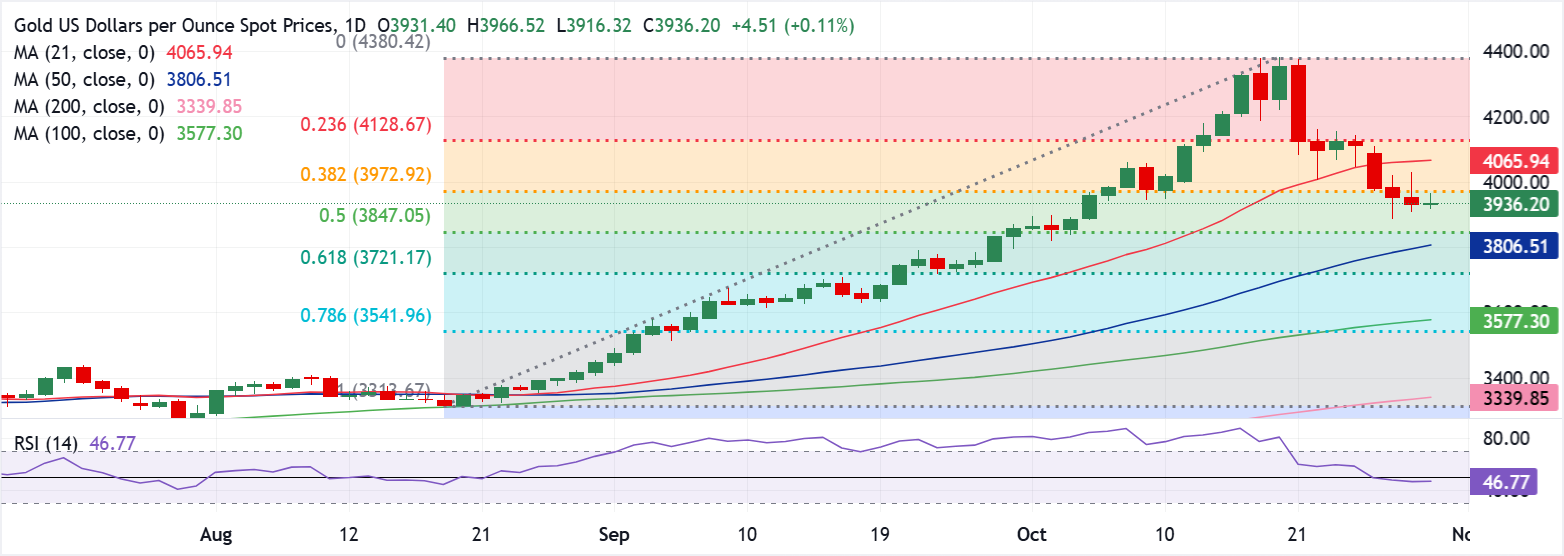
In the daily chart, XAU/USD is currently trading at around $3,938. A bullish 21 SMA advances above the longer ones, in line with the dominant bullish momentum; the 21 SMA stands at $4,066 and, being above spot, caps the immediate topside. Furthermore, the 50 SMA is also bullish, advancing below the shorter one; the 50 SMA stands at $3,807. Below spot, the 50 SMA at $3,807, the 100 SMA at $3,577 and the 200 SMA at $3,340 offer successive support levels, while the 21 SMA at $4,066 acts as resistance. The Relative Strength Index (14) has eased to 47, slipping below its neutral 50 mid-line after prior readings in extreme overbought territory; the latest uptick from 46 reduces bearish traction and favors consolidation as the broader moving-average structure remains positive.
Measuring the rally between $3,314 and $4,380, the 38.2% retracement stands at $3,973. With price currently beneath $3,973, initial resistance is located at $3,973, followed by $4,066 (21 SMA) and the 23.6% retracement at $4,129; a clearance of these levels would reassert the bullish sequence toward the top at $4,380. On the downside, support levels are $3,847 (50% retracement) ahead of $3,721 (61.8%), then $3,542 (78.6%) and $3,314 (100% of the measured upswing). As long as price holds above the rising 50 and 100 SMAs, pullbacks are likely to remain shallow, while a daily close back above $3,973 would be a near-term signal that buyers are regaining traction.
(This content was partially created with the help of an AI tool)
US-China Trade War FAQs
Generally speaking, a trade war is an economic conflict between two or more countries due to extreme protectionism on one end. It implies the creation of trade barriers, such as tariffs, which result in counter-barriers, escalating import costs, and hence the cost of living.
An economic conflict between the United States (US) and China began early in 2018, when President Donald Trump set trade barriers on China, claiming unfair commercial practices and intellectual property theft from the Asian giant. China took retaliatory action, imposing tariffs on multiple US goods, such as automobiles and soybeans. Tensions escalated until the two countries signed the US-China Phase One trade deal in January 2020. The agreement required structural reforms and other changes to China’s economic and trade regime and pretended to restore stability and trust between the two nations. However, the Coronavirus pandemic took the focus out of the conflict. Yet, it is worth mentioning that President Joe Biden, who took office after Trump, kept tariffs in place and even added some additional levies.
The return of Donald Trump to the White House as the 47th US President has sparked a fresh wave of tensions between the two countries. During the 2024 election campaign, Trump pledged to impose 60% tariffs on China once he returned to office, which he did on January 20, 2025. With Trump back, the US-China trade war is meant to resume where it was left, with tit-for-tat policies affecting the global economic landscape amid disruptions in global supply chains, resulting in a reduction in spending, particularly investment, and directly feeding into the Consumer Price Index inflation.
Author

Dhwani Mehta
FXStreet
Residing in Mumbai (India), Dhwani is a Senior Analyst and Manager of the Asian session at FXStreet. She has over 10 years of experience in analyzing and covering the global financial markets, with specialization in Forex and commodities markets.














