Gold Price Forecast: XAU/USD carves out a bear flag, eyes deeper losses below $1800
- Gold price remains exposed to downside risks amid a firmer US dollar.
- Covid concerns, US stimulus uncertainty boost USD’s safe-haven appeal.
- Gold’s four-hour chart points to deeper loss amid a potential bear flag

Having faced rejection above $1830 for the third day in a row, gold price came under heavy selling pressure on Tuesday and fell as low as $1792, clocking fresh weekly lows. Gold’s correction from two-month highs of $1834, as the US dollar rebound remained the main underlying theme. Investors faded the effects of an NFP shocker and a likely delay in the Fed’s tapering plan, as economic growth concerns resurfaced amid a spike in the Delta covid cases in the US. The risk-off mood seeped in with the return of the US traders, bolstering the safe-haven demand for the dollar at gold’s expense. Investors also remained cautious ahead of the ECB policy decision on Thursday while China’s regulatory crackdown extending beyond the tech sector also weighed on the market mood.
On Wednesday, gold price is licking its wounds after the previous sell-off, as the US dollar holds onto its recent gains amid a dour mood and weaker yields. Escalating Delta covid concerns in the US combined with expectations of ECB tapering keep the safe-haven demand for the greenback underpinned while limiting gold’s bounce. US President Joe Biden on Thursday will present a six-pronged strategy aimed at fighting the spread of the highly contagious Delta variant and increasing covid vaccinations. Further, uncertainty over the US infrastructure stimulus package could also likely weigh on gold price. According to CNN News, “House Republicans could face increased pressure to vote against a bipartisan infrastructure package when they return to Washington later this month.”
Looking ahead, in absence of any first-tier US economic news, the covid concerns could continue to influence the broader market sentiment, impacting the dollar and gold price. Although, the US JOLT jobs opening data could offer some trading incentives.
Gold Price Chart - Technical outlook
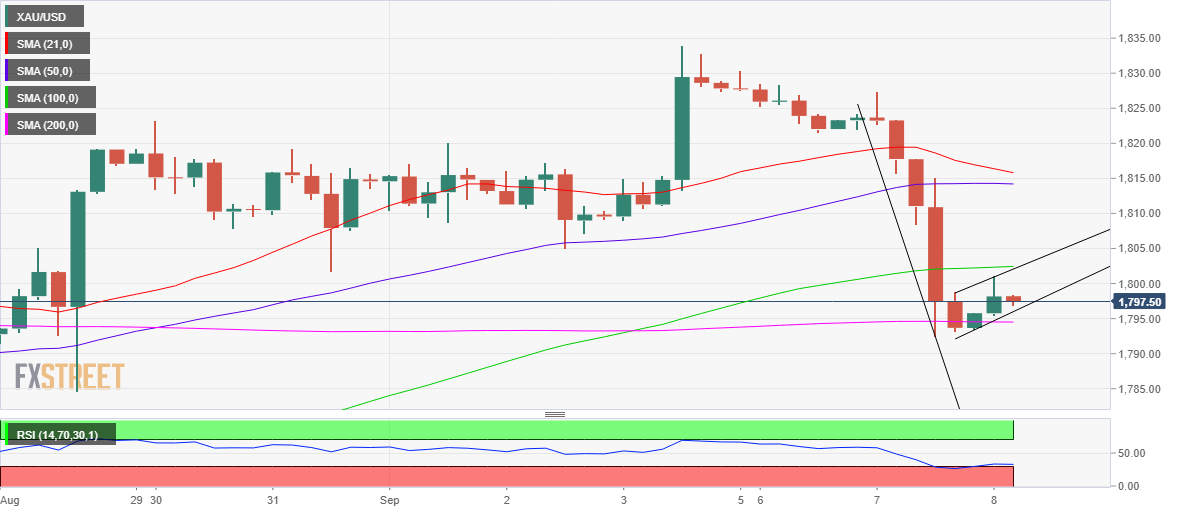
Gold: Four-hour chart
As observed on the four-hour chart, gold price has carved out a bear flag pattern, in light of the recent consolidation that followed Tuesday’s slide.
A sustained break below the confluence of the 200-Simple Moving Average (SMA) and rising trendline support at $1795 could confirm the bearish continuation pattern, calling for further downside towards $1760.
Ahead of that the mid-August lows around $1775 could test the bullish commitments.
The Relative Strength Index (RSI) is heading back towards the oversold territory, currently at 32.30, suggesting that there is more room to drop for gold price.
Alternatively, powerful resistance at $1802 will likely keep gold bulls capped, as that level is the intersection of the horizontal 100-SMA and rising trendline resistance.
A four-hourly candlestick closing above the latter could reinforce the recovery momentum, opening doors for a test of the next relevant upside barrier at $1814, the 50-SMA.
Author

Dhwani Mehta
FXStreet
Residing in Mumbai (India), Dhwani is a Senior Analyst and Manager of the Asian session at FXStreet. She has over 10 years of experience in analyzing and covering the global financial markets, with specialization in Forex and commodities markets.


