Gold Price Forecast: XAU/USD buyers stay hopeful whilst above 21-day SMA support
- Gold price finds support and looks at $2,650 as the US Nonfarm Payrolls week begins.
- The US Dollar corrects further despite firm US Treasury bond yields and a cautious mood.
- Technically, daily indicators continue to paint a bullish picture for Gold price.

Gold price is finding fresh demand early Monday as buyers look to regain $2,650 after correcting from three-week highs of $2,665 on Friday.
Gold price looks to US data and China’s stimulus optimism
The renewed upside in Gold price could be linked to fresh optimism surrounding more stimulus coming through from China after the People’s Bank of China (PBOC) pledged over the weekend that it will step up financial support for technology innovation and consumption stimulation as part of a continued effort to boost economic growth, per Bloomberg.
Additionally, Gold buyers cheer the strong Chinese Caixin Services PMI, which shot to a seven-month high of 52.2 in December versus 51.7 expected. China is the world’s biggest Gold consumer, and any efforts by the Chinese authorities to ramp up the economic performance will likely bode well for the bright metal.
Furthermore, markets remain wary of the upcoming policies of US President-elect Donald Trump and the US Federal Reserve (Fed), helping Gold price stay afloat even as the US Treasury bond yields continue to hold firm near multi-month highs.
The US Dollar (USD) has reversed strong US ISM Manufacturing PMI-led gains, currently trading in the red, aiding the Gold price rebound.
However, it remains to be seen if the USD sustains the pullback heading into the mid-tier US final PMI and Factory Orders data releases. Speeches by Fed policymakers will also remain crucuial to determining the Fed’s policy move this month, significantly impacting the USD-denominated Gold price.
Markets are also likely to trade cautiously, gearing up for a series of labor data from the US later this week.
Gold price technical analysis: Daily chart
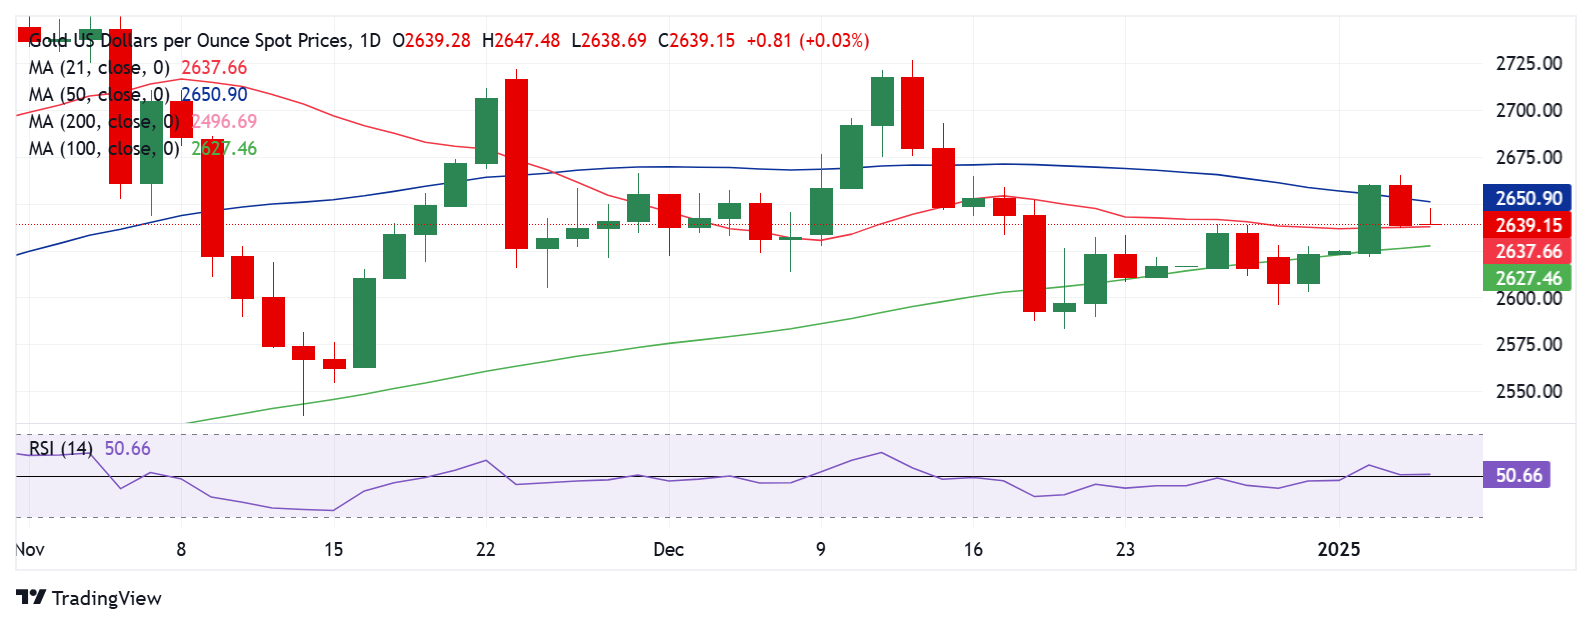
The daily chart shows that the 14-day Relative Strength Index (RSI) remains above the 50 level, backing the bullish bias for Gold price.
Meanwhile, Gold price defends the 21-day Simple Moving Average (SMA) at $2,638 after failing to sustain above the 50-day SMA of $2,651 on Friday.
Gold buyers remain poised to regain the 50-day SMA barrier as long as the 21-day SMA support holds.
The next relevant topside barrier is seen at the three-week high of $2,665, above which the $2,700 level will come into play.
On the flip side, a sustained move below the 21-day SMA at $2,638 will expose the 100-day SMA at $2,627.
A daily candlestick close below the latter will open the door for a retest of the previous week’s low of $2,596.
Gold FAQs
Gold has played a key role in human’s history as it has been widely used as a store of value and medium of exchange. Currently, apart from its shine and usage for jewelry, the precious metal is widely seen as a safe-haven asset, meaning that it is considered a good investment during turbulent times. Gold is also widely seen as a hedge against inflation and against depreciating currencies as it doesn’t rely on any specific issuer or government.
Central banks are the biggest Gold holders. In their aim to support their currencies in turbulent times, central banks tend to diversify their reserves and buy Gold to improve the perceived strength of the economy and the currency. High Gold reserves can be a source of trust for a country’s solvency. Central banks added 1,136 tonnes of Gold worth around $70 billion to their reserves in 2022, according to data from the World Gold Council. This is the highest yearly purchase since records began. Central banks from emerging economies such as China, India and Turkey are quickly increasing their Gold reserves.
Gold has an inverse correlation with the US Dollar and US Treasuries, which are both major reserve and safe-haven assets. When the Dollar depreciates, Gold tends to rise, enabling investors and central banks to diversify their assets in turbulent times. Gold is also inversely correlated with risk assets. A rally in the stock market tends to weaken Gold price, while sell-offs in riskier markets tend to favor the precious metal.
The price can move due to a wide range of factors. Geopolitical instability or fears of a deep recession can quickly make Gold price escalate due to its safe-haven status. As a yield-less asset, Gold tends to rise with lower interest rates, while higher cost of money usually weighs down on the yellow metal. Still, most moves depend on how the US Dollar (USD) behaves as the asset is priced in dollars (XAU/USD). A strong Dollar tends to keep the price of Gold controlled, whereas a weaker Dollar is likely to push Gold prices up.
Author

Dhwani Mehta
FXStreet
Residing in Mumbai (India), Dhwani is a Senior Analyst and Manager of the Asian session at FXStreet. She has over 10 years of experience in analyzing and covering the global financial markets, with specialization in Forex and commodities markets.