Gold Price Forecast: XAU/USD appears a ‘buy on dips’ trade amid Middle East strife
- Gold price faces rejection just shy of $2,000, extending correction early Monday.
- US Dollar tracks US Treasury bond yields higher; finds support from a cautious mood.
- Upside risks remain intact for Gold price amid bullish RSI and geopolitical tensions.

Gold price is consolidating its correction from five-month lows, keeping the red near $1,975 early Monday. Gold price fell for the first time in four trading days, although the downside remains cushioned amid lingering Middle East tensions and a busy United States (US) economic calendar this week.
Focus remains on US Treasury yields and Middle East tensions
Despite some conciliatory news from the Middle East geopolitical front over the weekend, investors trading with caution as risks of a flare-up still persist. Over the weekend, Hamas released two US hostages and aid entered through Egypt’s border with Gaza. Amidst signs of a potential thaw, Gold price extended its correction, having reached the highest level in five months at $1,997 on Friday. A renewed upswing in the US Treasury bond yields also corroborated the pullback in Gold price.
However, news that Israel stepped up air raids on Gaza in preparation for the “next phase” of its conflict with Hamas while warning that Hezbollah risks dragging Lebanon into a wider regional war continues to keep the tensions alive. Geopolitical risks remain supportive of the safe-haven United States Dollar (USD) at the expense of Gold price.
The US Treasury bond yields resume its uptrend, as the bond market rout returns at the start of the week. The supply-demand mismatch for the US Treasuries, amid a budget deficit and looming risks of a government shutdown, keeps pushing the US Treasury bond yields through the roof. The benchmark 10-year US Treasury bond yields are approaching the 5.0% key level once again, checking the upside attempts in the non-interest-bearing Gold price.
Markets also remain cautious, bracing for the US growth and inflation data,, as well as earnings from some of the world's largest tech companies due later this week. The top-tier US economic data could have a strong implication on the US Federal Reserve’s (Fed) interest rates outlook in the coming months, eventually influencing the US Dollar and Gold price dynamics.
In the meantime, the Middle East conflict will be closely eyed, in the absence of any speeches from Fed policymakers, as the US central bank has entered a ‘blackout period’ before next week’s policy meeting.
Gold price technical analysis: Daily chart
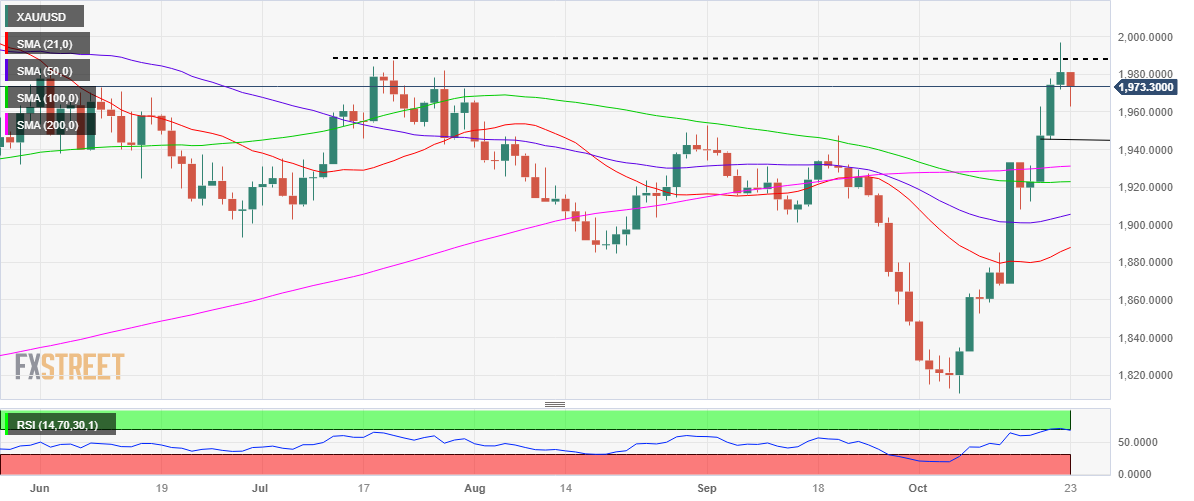
Gold price remains a ‘buy-the-dip’ trade, as the 14-day Relative Strength Index (RSI) indicator has eased off from the overbought region to now trade in the bullish zone, keeping the door open for a fresh upswing.
The initial supply zone will be met at $1,988 (July 20 high), above which the five-month highs of $1,997 will be retested. The $2,000 threshold will be a tough nut to crack for Gold buyers.
On the flip side, further retracement from multi-month highs could need a sustained move below the intraday low of $1,963.
The $1,950 psychological level will be the next support in sight for Gold buyers. The last line of defense for them will be the October 19 low of $1,945.
Premium
You have reached your limit of 3 free articles for this month.
Start your subscription and get access to all our original articles.
Author

Dhwani Mehta
FXStreet
Residing in Mumbai (India), Dhwani is a Senior Analyst and Manager of the Asian session at FXStreet. She has over 10 years of experience in analyzing and covering the global financial markets, with specialization in Forex and commodities markets.


