Gold Price Forecast: Will Fed Minutes help validate bullish wedge for XAU/USD?
- Gold price hits weekly highs on the US Independence Day-led thin trading.
- US Dollar capitalizes on recession fears and US-Sino tech fight ahead of the Fed Minutes.
- Gold price needs a daily close above $1,922 to confirm a bullish wedge but bearish RSI warrants caution.

Gold price is consolidating a minor uptick to week highs of $1,931 seen on Tuesday, as bulls and bears remain in a tug-of-war early Wednesday. Gold price is bracing for a return of the United States traders after an extended Independence Day holiday, awaiting the Minutes of the US Federal Reserve (Fed) June policy meeting.
United States Dollar holds ground ahead of Federal Reserve Minutes
Amidst July 4 thin market conditions, the United States Dollar (USD) managed to find its footing across the board, courtesy of growing recession fears, as the Federal Reserve is likely to continue with its rate hike track to tame inflation. The impact of the Fed tightening is already worsening the US business conditions, as the country’s manufacturing sector contraction deepened in June, according to the latest ISM data published on Monday.
The risk-averse market environment capped the recent uptrend in the US Treasury bond yields, driving the non-yielding Gold price to fresh weekly highs. However, Gold sellers continued to lurk above the $1,930 mark amidst resurgent US Dollar demand.
In early Wednesday’s trading, risk-off flows continue dominating as risks of a revival in the US-China trade war are back on the table after the US curbed AI chips’ shipments to Beijing. In response, China announced abrupt controls on exports of some gallium and germanium products, effective from August 1. Meanwhile, there are reports that US President Joe Biden’s administration is preparing to restrict Chinese companies’ access to US cloud-computing services.
If the trade tensions intensify, the US Dollar is likely to draw plenty of safe-haven bids, in turn, weighing on the USD-denominated Gold price. The focus also remains on the Fed Minutes due later in American trading for fresh insights on the Fed rate hike path, eventually influencing the Gold price direction ahead of the key US jobs data slated for release in the latter part of the week.
Gold price technical analysis: Daily chart
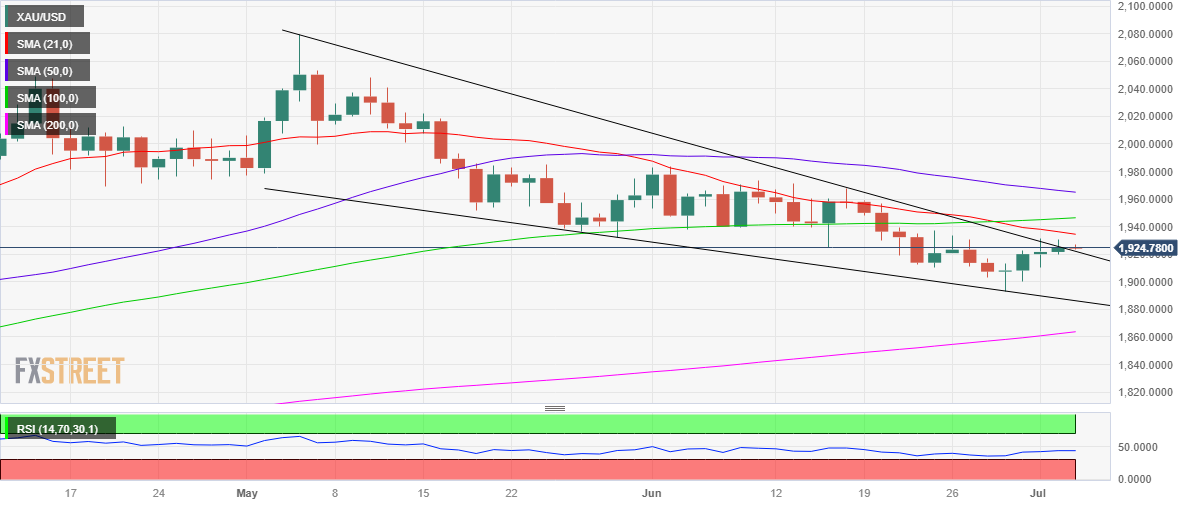
Gold price remains on track to confirm a bullish wedge, awaiting a daily close above the critical falling trendline (wedge) resistance, now at $1922. Gold price has been trading within a falling wedge after topping out at record highs of $2080 in early April.
However, it remains to be seen if Gold bulls succeed to regain the upside traction, as a Bear Cross and bearish Relative Strength Index (RSI) continue to warrant caution.
Acceptance above the falling trendline resistance of $1,922 on a daily closing basis will open doors for a fresh upswing toward the $1,950 threshold, where the mildly bullish 50-Daily Moving Average (DMA) hangs. Ahead of that, Gold buyers could run into stiff resistance at the downward-sloping 21 DMA at $1,934.
On the downside, immediate support awaits at Monday’s low of $1,910, below which the $1,900 key level will be tested. The next cushion is envisioned at the three-month low of $1,893.
Premium
You have reached your limit of 3 free articles for this month.
Start your subscription and get access to all our original articles.
Author

Dhwani Mehta
FXStreet
Residing in Mumbai (India), Dhwani is a Senior Analyst and Manager of the Asian session at FXStreet. She has over 10 years of experience in analyzing and covering the global financial markets, with specialization in Forex and commodities markets.