Gold price forecast: US Dollar strength and Trump tariffs weigh on Gold

Gold (XAU/USD ) is facing renewed selling pressure as multiple factors weigh on market sentiment. The strengthening US Dollar and Trump’s looming July 9 tariff deadline are driving uncertainty. Investors are shifting capital into the Dollar, reducing demand for non-yielding assets, such as gold. A stronger-than-expected US jobs report has also reduced hopes for aggressive Fed rate cuts. With these headwinds in place, traders are now turning to technical signals and upcoming FOMC minutes for guidance.
Gold price under pressure as Dollar strengthens and trade deadline looms
Gold is under pressure from several converging forces. Renewed strength in the US Dollar is weighing heavily on its price. Trump's aggressive trade stance continues to shake investor confidence. His July 9 deadline for trade agreements has added urgency to global negotiations. Any country that fails to finalize a deal may face steep tariffs. The threat includes a base 10% tariff and possibly up to 70% for some nations.
Markets are particularly concerned about potential tariffs on BRICS nations. This threat is pushing capital into the US Dollar, the world’s top safe-haven currency. The dollar’s rise naturally pressures non-yielding assets, such as gold. Meanwhile, a strong US employment report has further reduced the likelihood of aggressive monetary easing. Nonfarm payrolls increased by 147,000 in June, outpacing expectations. Unemployment also dropped to 4.1%, showing labour market resilience.
This economic strength weakens the argument for rapid interest rate cuts. With fewer rate cuts likely, gold loses one of its key support factors. Traders are now shifting focus to Wednesday’s release of the FOMC meeting minutes. These minutes could provide clues about the Federal Reserve’s future actions.
Gold trading at critical support in ascending triangle pattern
The gold chart below shows a well-defined ascending triangle pattern on the 4-hour timeframe. This pattern typically signals bullish continuation. Gold has consistently respected an ascending trendline that started forming in March. Each major pullback has found support at this trendline.
Currently, gold is trading just above the trendline near the $3,312 level. Despite recent selling pressure, the price action remains within the established triangle structure. Horizontal resistance remains strong around the $3,500 mark, which is the breakout target of the pattern. The upper boundary has been tested multiple times but has not broken yet.
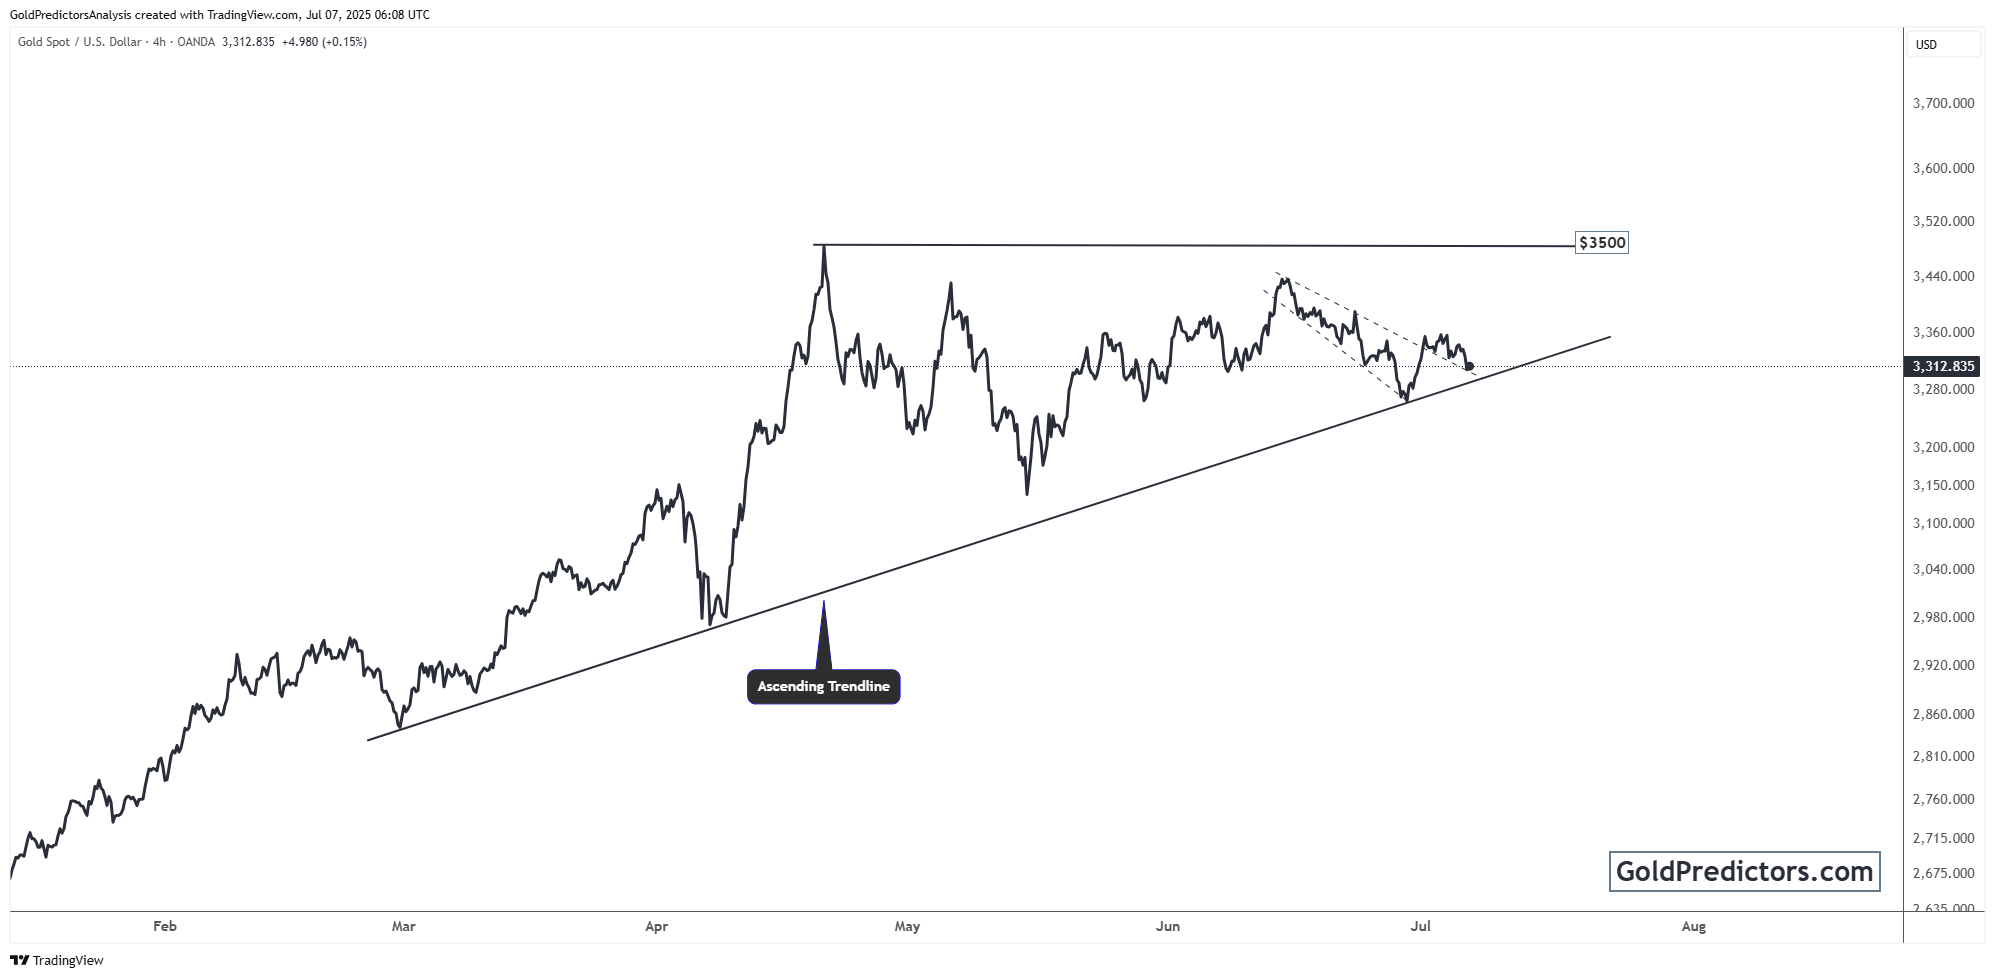
A temporary falling wedge within the larger triangle recently broke to the upside, suggesting short-term bullish momentum. As long as gold holds above the ascending trendline, the bullish outlook remains intact. If price manages to close above $3,500 with volume, it could trigger a new rally.
On the downside, a breakdown below the ascending trendline would invalidate the pattern. This could expose gold to deeper corrections toward the $3,250 or even $3,150 levels. However, the current structure suggests continued accumulation in the near term. An eventual breakout remains likely, as long as no major negative surprises disrupt market sentiment.
Conclusion
Gold’s current price action reflects a mix of geopolitical risk, economic strength, and technical consolidation. The metal is under pressure due to a strong US Dollar and rising trade tensions. However, the ascending triangle on the chart shows that bullish momentum may resume if conditions improve. For now, gold investors remain cautious, watching tariff headlines and the upcoming FOMC minutes for the next market cue.
Unlock exclusive gold and silver trading signals and updates that most investors don’t see. Join our free newsletter now!
Unlock exclusive gold and silver trading signals and updates that most investors don’t see. Join our free newsletter now!
Author

Muhammad Umair, PhD
Gold Predictors
Muhammad Umair is a financial markets analyst and investor who focuses on the forex and precious metals markets.


