Gold Price Forecast: Risks appear skewed to the upside for XAU/USD heading into ECB, US GDP
- Gold price looks north while near $1,800, with eyes on ECB, US Q3 GDP.
- Gold keeps an eye on Treasury yields while the USD clings to recovery gains.
- Gold teases descending triangle on the 4H chart, with upside risks likely.

Gold price enjoyed good two-way businesses on Wednesday, as bulls were rescued once again near the $1,782 region. The bright metal extended Tuesday’s decline in the first half of the day, as the US dollar held firmer amid a fresh uptick in the Treasury yields across the board. Stronger Australian inflation readings intensified global concerns over the persistent rise in price pressures and their impact on the economic recovery. The dour market mood buoyed the dollar’s safe-haven demand.
The greenback failed to hold bid, however, and slipped following the release of mixed US Durable Goods Orders data while soft corporate earnings reports spooked the markets, as they underscored the supply chain crisis and inflation fears. The sharp sell-off in the USD/CAD pair, as the Bank of Canada (BOC) ended its pandemic stimulus measures, added to the dollar’s misery, supporting the rebound in gold price towards the $1,800 mark. An ongoing correction in Treasury yields from multi-month tops also provided a tailwind to the metal’s upswing.
Gold price is building onto Wednesday’s recovery in the lead-up to the European Central Bank (ECB) decision and the US Q3 GDP release. The greenback is struggling to find its feet while yields attempt a bounce despite the risk-off market mood. Investors turn cautious and seek shelter in the traditional safe-haven gold, awaiting the ECB outcome for clues on whether they would consider tightening monetary policy earlier than thought. Also, deepening concerns over supply disruptions, in the face of potential monetary policy normalization by major central banks keep markets on the edge. Besides, US Q3 growth figures will provide fresh intel on the economic recovery, with the country likely to grow 2.7% QoQ vs. a 6.7% jump seen previously. In the meantime, risk sentiment and the dynamics in the dollar will continue to influence gold price action.
Gold Price Chart - Technical outlook
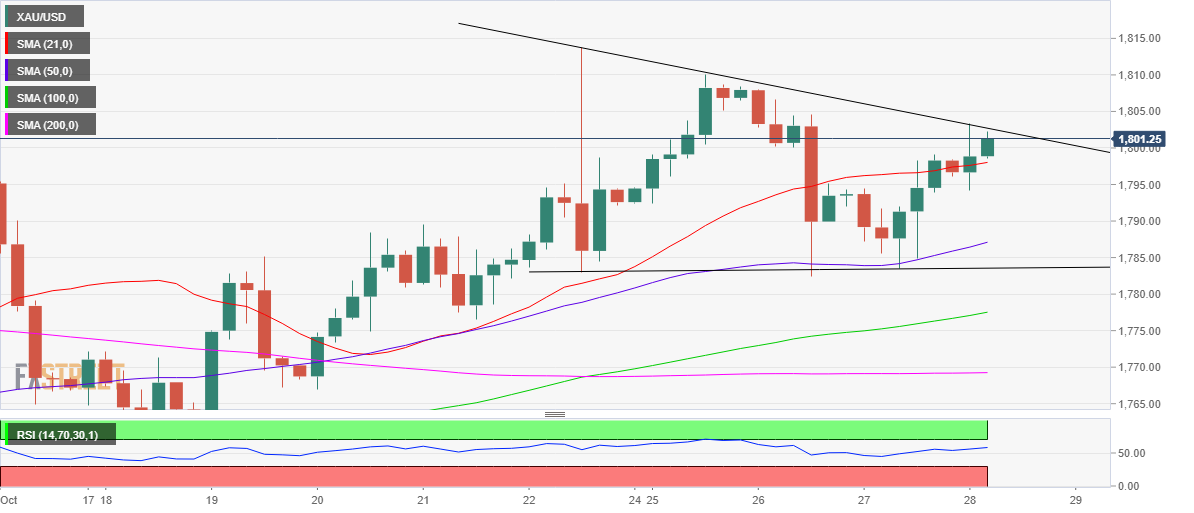
Gold: Four-hour chart
Gold’s four-hour chart shows that the price has been teasing a descending triangle breakout, with a candlestick closing above the falling trendline resistance at $1,803 awaited.
If the upside breakout from the triangle materializes, then a fresh advance towards the weekly highs of $1,810 cannot be ruled out.
The Relative Strength Index (RSI) looks north while sitting comfortably above the midline, adding credence to the bullish potential.
Further upside will call for a test of the previous week’s high of $1,814. The next goal for gold bulls remains the pattern target measured at $1,835, where the September month highs coincide.
On the flip side, the 21-Simple Moving Average (SMA) at $1,798 will be the immediate cushion, below which the daily lows of $1,794 could get retested.
A sharp drop towards the bullish 50-SMA at $1,787 will be on the cards, if the latter caves in. The last line of defense for gold buyers is seen at the horizontal trendline resistance at $1,782.
Premium
You have reached your limit of 3 free articles for this month.
Start your subscription and get access to all our original articles.
Author

Dhwani Mehta
FXStreet
Residing in Mumbai (India), Dhwani is a Senior Analyst and Manager of the Asian session at FXStreet. She has over 10 years of experience in analyzing and covering the global financial markets, with specialization in Forex and commodities markets.


