- Gold's weekly chart is flashing long-term bear revival, i.e. the sell-off from the record high of $1,92.94 (September 2011 high) has resumed.
- The breakdown is accompanied by pick up in volatility from record low levels, Bollinger Band width indicates.
- $1,200 could be put to test by the end of 2018.
Currently, gold is trading at $1,240, having clocked a seven-month low of $1,236.52 earlier today and looks set to extend losses further towards $1,200 by the year-end, the technical charts indicate.
Weekly chart: Bearish continuation pattern
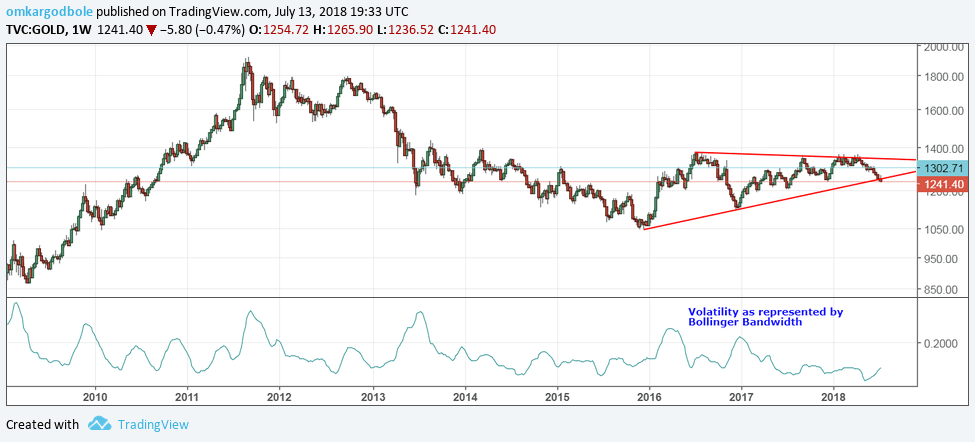
The metal looks set to end the week below the trendline sloping upwards from the December 2015 low and December 2016 low.
However, if we increase the chart time range, the break of the trendline looks more like a pennant breakdown - a bearish continuation pattern, which indicates the sell-off from the 2011 high of $1,920.24 has resumed.
Simply put, the corrective rally from the December 2015 low of $1,046 has ended and the bears are back in a commanding position.
Hence, the metal could drop to/below $1,200 in the next six months and could revisit $1,046 in the long-run.
Further, the volatility, as represented by the spread between the Bolling Bands (standard deviation of +2,-2 on 20-week moving average), has picked up from the record lows seen in the first half of May, adding credence to the pennant breakdown, but is holding (currently at 0.10) well below the recent high of 0.22 seen in January 2017.
So, it can be argued the sell-off has just begun and there is plenty of room for a further rise in volatility and drop in gold prices.
The moving averages also confirm the bearish view. For instance, 5-week and 10-week MA are trending south. Meanwhile, at 34.00, the relative strength index (RSI) is biased toward the bears.
View
The weekly chart shows a long-term bearish revival, so prices risk falling to/below $1,200 in the next six months.
The 200-week MA support of $1,234 will likely hold for a few weeks, and a minor corrective rally cannot be ruled out, courtesy of the short-term oversold conditions. However, the bias would still remain bearish and only multiple weekly closes above the 10-week MA would abort the bearish view.
Information on these pages contains forward-looking statements that involve risks and uncertainties. Markets and instruments profiled on this page are for informational purposes only and should not in any way come across as a recommendation to buy or sell in these assets. You should do your own thorough research before making any investment decisions. FXStreet does not in any way guarantee that this information is free from mistakes, errors, or material misstatements. It also does not guarantee that this information is of a timely nature. Investing in Open Markets involves a great deal of risk, including the loss of all or a portion of your investment, as well as emotional distress. All risks, losses and costs associated with investing, including total loss of principal, are your responsibility. The views and opinions expressed in this article are those of the authors and do not necessarily reflect the official policy or position of FXStreet nor its advertisers. The author will not be held responsible for information that is found at the end of links posted on this page.
If not otherwise explicitly mentioned in the body of the article, at the time of writing, the author has no position in any stock mentioned in this article and no business relationship with any company mentioned. The author has not received compensation for writing this article, other than from FXStreet.
FXStreet and the author do not provide personalized recommendations. The author makes no representations as to the accuracy, completeness, or suitability of this information. FXStreet and the author will not be liable for any errors, omissions or any losses, injuries or damages arising from this information and its display or use. Errors and omissions excepted.
The author and FXStreet are not registered investment advisors and nothing in this article is intended to be investment advice.
Recommended Content
Editors’ Picks
EUR/USD stays below 1.0800 after upbeat US data
EUR/USD stays under bearish pressure and trades slightly below 1.0800 in the American session on Thursday. The data from the US showed that the real GDP growth for the fourth quarter got revised higher to 3.4% from 3.2%, supporting the USD and weighing on the pair.
GBP/USD stays in daily range above 1.2600
GBP/USD fluctuates in a narrow channel above 1.2600 on Thursday. The better-than-expected Initial Jobless Claims data from the US and the upward revision to the Q4 GDP growth helps the USD stay resilient against its rivals and limits the pair's upside.
Gold clings to strong daily gains above $2,200
Gold retreats from daily highs but holds comfortably above $2,200 in the American session on Friday. The benchmark 10-year US Treasury bond yield stays above 4.2% after upbeat US data and makes it difficult for XAU/USD to preserve its bullish momentum.
XRP price falls to $0.60 support as Ripple ruling doesn’t help Coinbase lawsuit against SEC
XRP programmatic sales ruling by Judge Torres was completely rejected by another US Court that ruled in favor of the SEC in a lawsuit against Coinbase.
Portfolio rebalancing and reflation trades emerge into Q2
Yesterday’s price action pointed at a possible end-of-quarter portfolio rebalancing as the session saw the laggards of the quarter like Apple and Tesla gain, and the stars like Microsoft and Nvidia retreat.