Gold Price Forecast: Fresh record high or pullback for XAU/USD on US CPI inflation?
- Gold consolidates the upside, bracing for the US CPI event risk on Thursday.
- US Dollar stays defensive as US PPI ramps up the odds for aggressive Fed easing.
- Concerns over geopolitics and the Fed’s autonomy remain a drag on the USD.
- Technically, Gold appears in a tough spot, with a move likely in either direction on US inflation report.

Gold is treading water near $3,650 early Thursday, lacking a clear directional impetus heading into the US Consumer Price Index (CPI) inflation test.
Gold readies for a big reaction to the US CPI inflation data
Gold has entered an upside consolidative phase below all-time highs of $3,675 in Asian trading on Thursday, following a decent comeback on Wednesday.
The next decisive move in the bright metal remains at the mercy of the August US CPI report as it could affirm the markets’ expectations for three interest rate cuts by the Federal Reserve (Fed) this year, while also determining if the US central bank would opt for a jumbo rate cut next week.
Markets are pricing in a 92% chance of a 25 basis points (bps) rate cut at the Fed's September meeting and an 8% probability of a 50 bps rate cut, according to the CME Group's FedWatch tool.
Meanwhile, Goldman Sachs, Barclays and National Australia Bank (NAB) now see three Fed rate reductions this year, starting next week.
The US annual CPI is forecast to rise 2.9% in August, compared to a 2.7% growth seen before, while the core CPI is expected to increase by 3.1%, at the same pace as in July.
On a monthly basis, US CPI and core CPI are set to advance by 0.3% in the same period.
Markets are expecting the impact of US President Donald Trump’s tariffs to feed into prices in the August prints.
Therefore, a hotter-than-expected US CPI readings could pour cold water on the latest growing bets of aggressive Fed easing in the balance of the year, offering some much-needed comfort to the US Dollar (USD) at the expense of the non-yielding Gold.
On the other hand, Gold could renew record highs on a downside surprise in the US inflation data, which would double down on expectations of more than two Fed rate cuts this year.
An unexpected slowdown in the US consumer price pressures cannot be ruled out after Wednesday’s surprise fall in producer inflation for August.
The Producer Price Index (PPI) for final demand dipped 0.1% last month after a downwardly revised 0.7% jump in July. Annually, PPI inflation fell to 2.6% in August versus 3.1% (revised from 3.3%) in July.
Softer-than-expected US PPI data exerted additional downside pressure on the Greenback, already undermined by Trump’s fresh attacks on Fed Chair Jerome Powell.
Amidst sustained USD weakness, Gold further benefited from lingering geopolitical tensions, especially in the face of Tuesday’s suspected Russian drone incursions into Poland’s airspace and Israel attacks on Hamas leadership in Doha, Qatar.
Gold price technical analysis: Daily chart
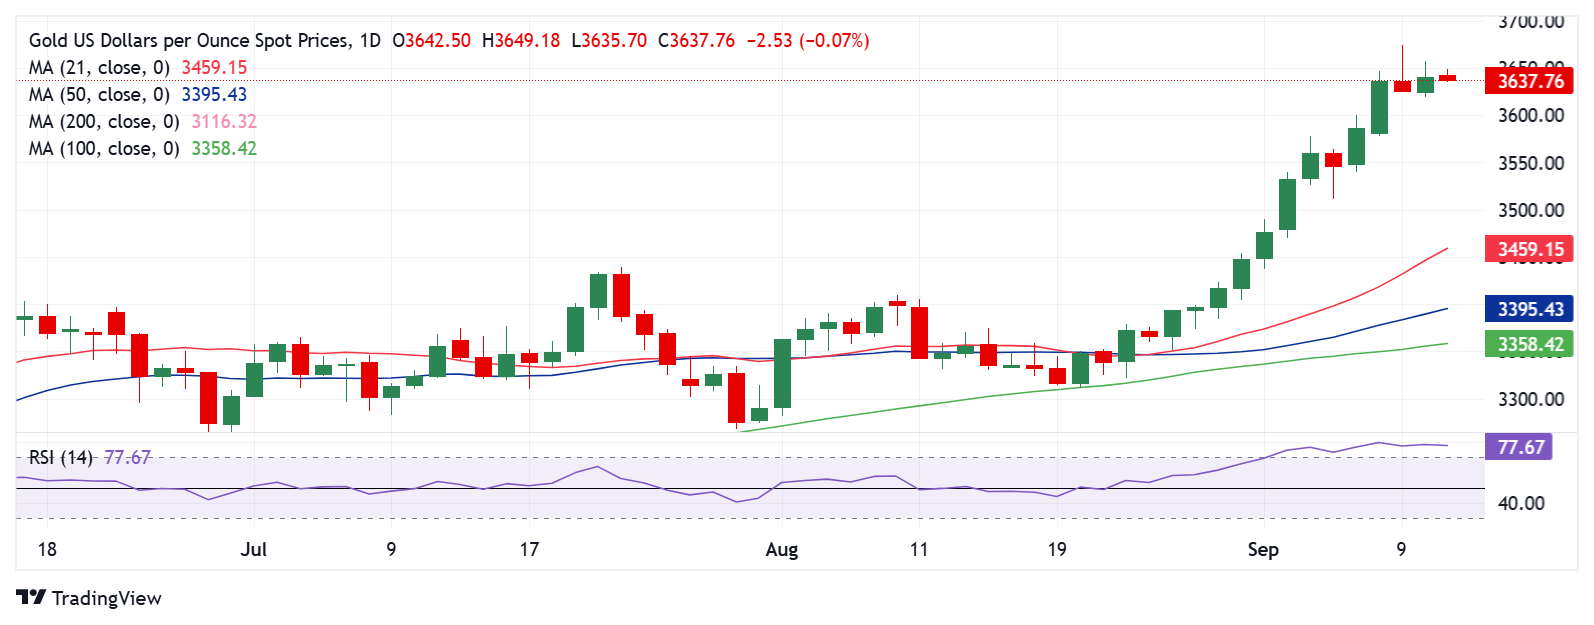
The daily chart shows that Gold faces two-way risks in the lead-up to the US CPI showdown.
The 14-day Relative Strength Index (RSI) is gradually easing from the extreme overbought zone, still remains near 78, as of writing.
If sellers emerge powerful, the immediate support is seen at the $3,600 round number, below which this week’s low of $3,578 could be tested.
A sustained break below the latter will open up a fresh downside toward the $3,550 psychological mark.
However, if buyers spring back on US CPI cool off, the record high of $3,675 will be threatened once again on the way to the $3,700 level
The next topside barrier is seen at around the $3,750 region.
Economic Indicator
Consumer Price Index (YoY)
Inflationary or deflationary tendencies are measured by periodically summing the prices of a basket of representative goods and services and presenting the data as The Consumer Price Index (CPI). CPI data is compiled on a monthly basis and released by the US Department of Labor Statistics. The YoY reading compares the prices of goods in the reference month to the same month a year earlier.The CPI is a key indicator to measure inflation and changes in purchasing trends. Generally speaking, a high reading is seen as bullish for the US Dollar (USD), while a low reading is seen as bearish.
Read more.Next release: Thu Sep 11, 2025 12:30
Frequency: Monthly
Consensus: 2.9%
Previous: 2.7%
Source: US Bureau of Labor Statistics
The US Federal Reserve (Fed) has a dual mandate of maintaining price stability and maximum employment. According to such mandate, inflation should be at around 2% YoY and has become the weakest pillar of the central bank’s directive ever since the world suffered a pandemic, which extends to these days. Price pressures keep rising amid supply-chain issues and bottlenecks, with the Consumer Price Index (CPI) hanging at multi-decade highs. The Fed has already taken measures to tame inflation and is expected to maintain an aggressive stance in the foreseeable future.
Inflation FAQs
Inflation measures the rise in the price of a representative basket of goods and services. Headline inflation is usually expressed as a percentage change on a month-on-month (MoM) and year-on-year (YoY) basis. Core inflation excludes more volatile elements such as food and fuel which can fluctuate because of geopolitical and seasonal factors. Core inflation is the figure economists focus on and is the level targeted by central banks, which are mandated to keep inflation at a manageable level, usually around 2%.
The Consumer Price Index (CPI) measures the change in prices of a basket of goods and services over a period of time. It is usually expressed as a percentage change on a month-on-month (MoM) and year-on-year (YoY) basis. Core CPI is the figure targeted by central banks as it excludes volatile food and fuel inputs. When Core CPI rises above 2% it usually results in higher interest rates and vice versa when it falls below 2%. Since higher interest rates are positive for a currency, higher inflation usually results in a stronger currency. The opposite is true when inflation falls.
Although it may seem counter-intuitive, high inflation in a country pushes up the value of its currency and vice versa for lower inflation. This is because the central bank will normally raise interest rates to combat the higher inflation, which attract more global capital inflows from investors looking for a lucrative place to park their money.
Formerly, Gold was the asset investors turned to in times of high inflation because it preserved its value, and whilst investors will often still buy Gold for its safe-haven properties in times of extreme market turmoil, this is not the case most of the time. This is because when inflation is high, central banks will put up interest rates to combat it. Higher interest rates are negative for Gold because they increase the opportunity-cost of holding Gold vis-a-vis an interest-bearing asset or placing the money in a cash deposit account. On the flipside, lower inflation tends to be positive for Gold as it brings interest rates down, making the bright metal a more viable investment alternative.
Author

Dhwani Mehta
FXStreet
Residing in Mumbai (India), Dhwani is a Senior Analyst and Manager of the Asian session at FXStreet. She has over 10 years of experience in analyzing and covering the global financial markets, with specialization in Forex and commodities markets.


