Gold Price Forecast: Focus remains on yields as XAU/USD eyes a pennant breakout
- Gold price remains vulnerable amid rallying US Treasury yields, USD gains.
- Risk-on mood weighs on US bonds, gold amid Fed’s hawkish shift.
- Gold price is teasing a pennant breakout on the 4H chart, downside favored.

The recovery in gold price near six-week lows lost momentum on Monday, as the persistent rally in the US Treasury yields across the curve, lifted the demand for the dollar at the expense of the non-yielding gold. In the early part of the day, gold price regained ground, as the greenback eased amid improving market mood. Investors looked past the uncertainty over China Evergrande’s debt issue, cheering the underlying economic optimism, reflective of the hawkish shift in the world’s major central banks, including the Fed and the BOE. Further, expectations of the passage of the US infrastructure bill on Thursday also underpinned gold price.
However, the tide turned in the favor of gold bears after the upbeat market mood and anticipation ahead of Fed Chair Jerome Powell’s testimony drove the 10-year US Treasury yields to three-month highs above 1.51%. Gold price settled at the $1750 psychological level, recovering from daily lows, helped by the negative on Wall Street indices.
Gold is alternating between gains and losses so far this Tuesday amid a recovery in the risk sentiment, which has refueled the rally in the US yields. Meanwhile, the US dollar clings on to the recent upside, keeping a check on gold price. Markets were cautious in early Asia on news that the Shenzhen government is investigating a unit of the debt-laden Evergrande. Concerns over the US debt ceiling deadlock also weighed on the investors’ sentiments but the ongoing rally in oil prices lifted the global stocks, bringing back the risk-on flows.
Looking ahead, Fed Chair Jerome Powell’s testimony on the CARES act, Evergrande updates and the dynamics in the Treasury yields will play out, impacting gold price action. In the prepared remarks, Powell reiterated that he expects strong growth for the rest of the year despite risks from the coronavirus delta variant while adding that the Fed would act against "sustained" higher inflation.
Gold Price Chart - Technical outlook
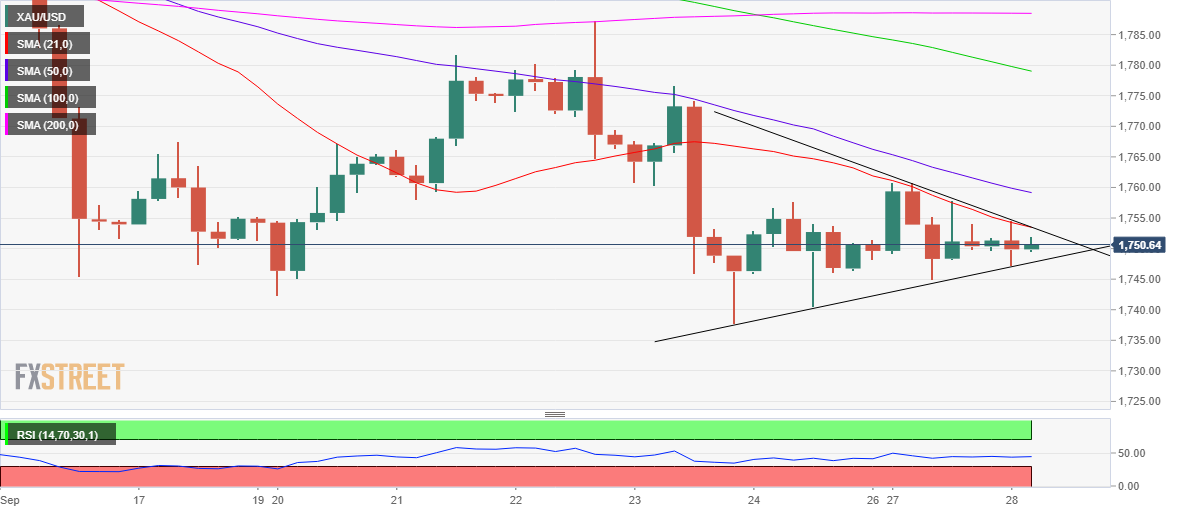
Gold: Four-hour chart
As observed on the four-hour chart, gold price is wavering in a pennant formation, with a breakout expected in either direction in the session ahead.
With the Relative Strength Index (RSI) still lurking below the midline, the odds of a downside breakout from the pennant look higher.
Also, a powerful resistance awaits at $1754, which is the confluence of the falling trendline resistance and the downward sloping 21-Simple Moving Average (SMA), which could emerge as a tough nut to crack for gold bulls.
Acceptance above the latter is needed to rekindle a fresh upswing towards the downward-sloping 50-SMA at $1759. The next relevant upside target is seen at the September 23 highs of $1777.
On the downside, gold sellers look to challenge the rising trendline (pennant) support at $1747.
A sustained break below the latter will validate the pennant breakdown, opening floors for a retest of the six-week troughs of $1738, below which the falling trendline support at $1735 would be put to test.
Author

Dhwani Mehta
FXStreet
Residing in Mumbai (India), Dhwani is a Senior Analyst and Manager of the Asian session at FXStreet. She has over 10 years of experience in analyzing and covering the global financial markets, with specialization in Forex and commodities markets.

















