Gold price forecast: Does $4,200 hold? Everything else depends on it
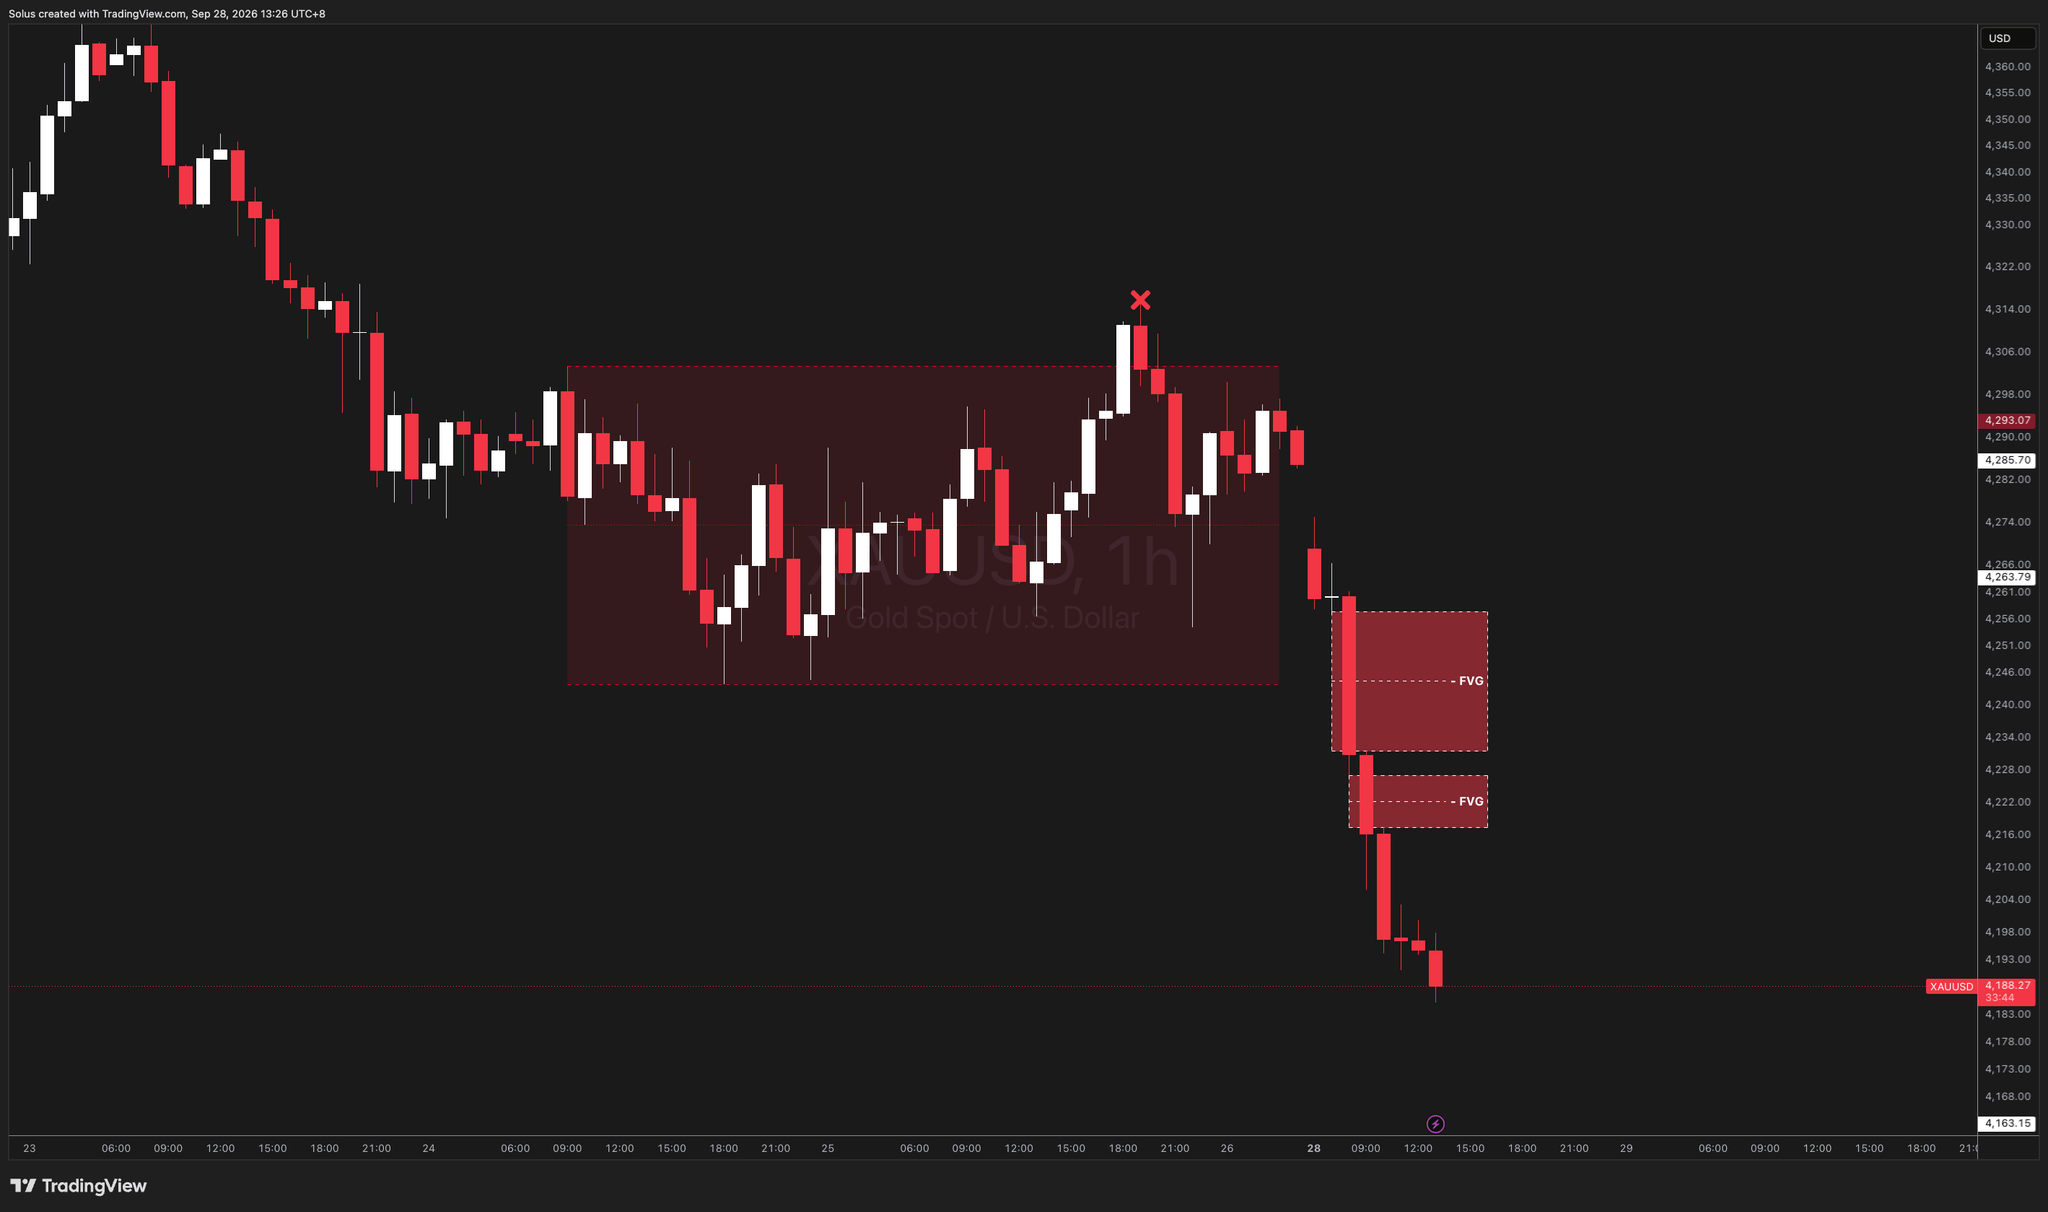
- Gold dropped about 2% in Asia and is testing $4,200, a level that has held for eight weeks.
- The dollar sits near 101 and the 10-year yield is above 5%. Both are still working against gold.
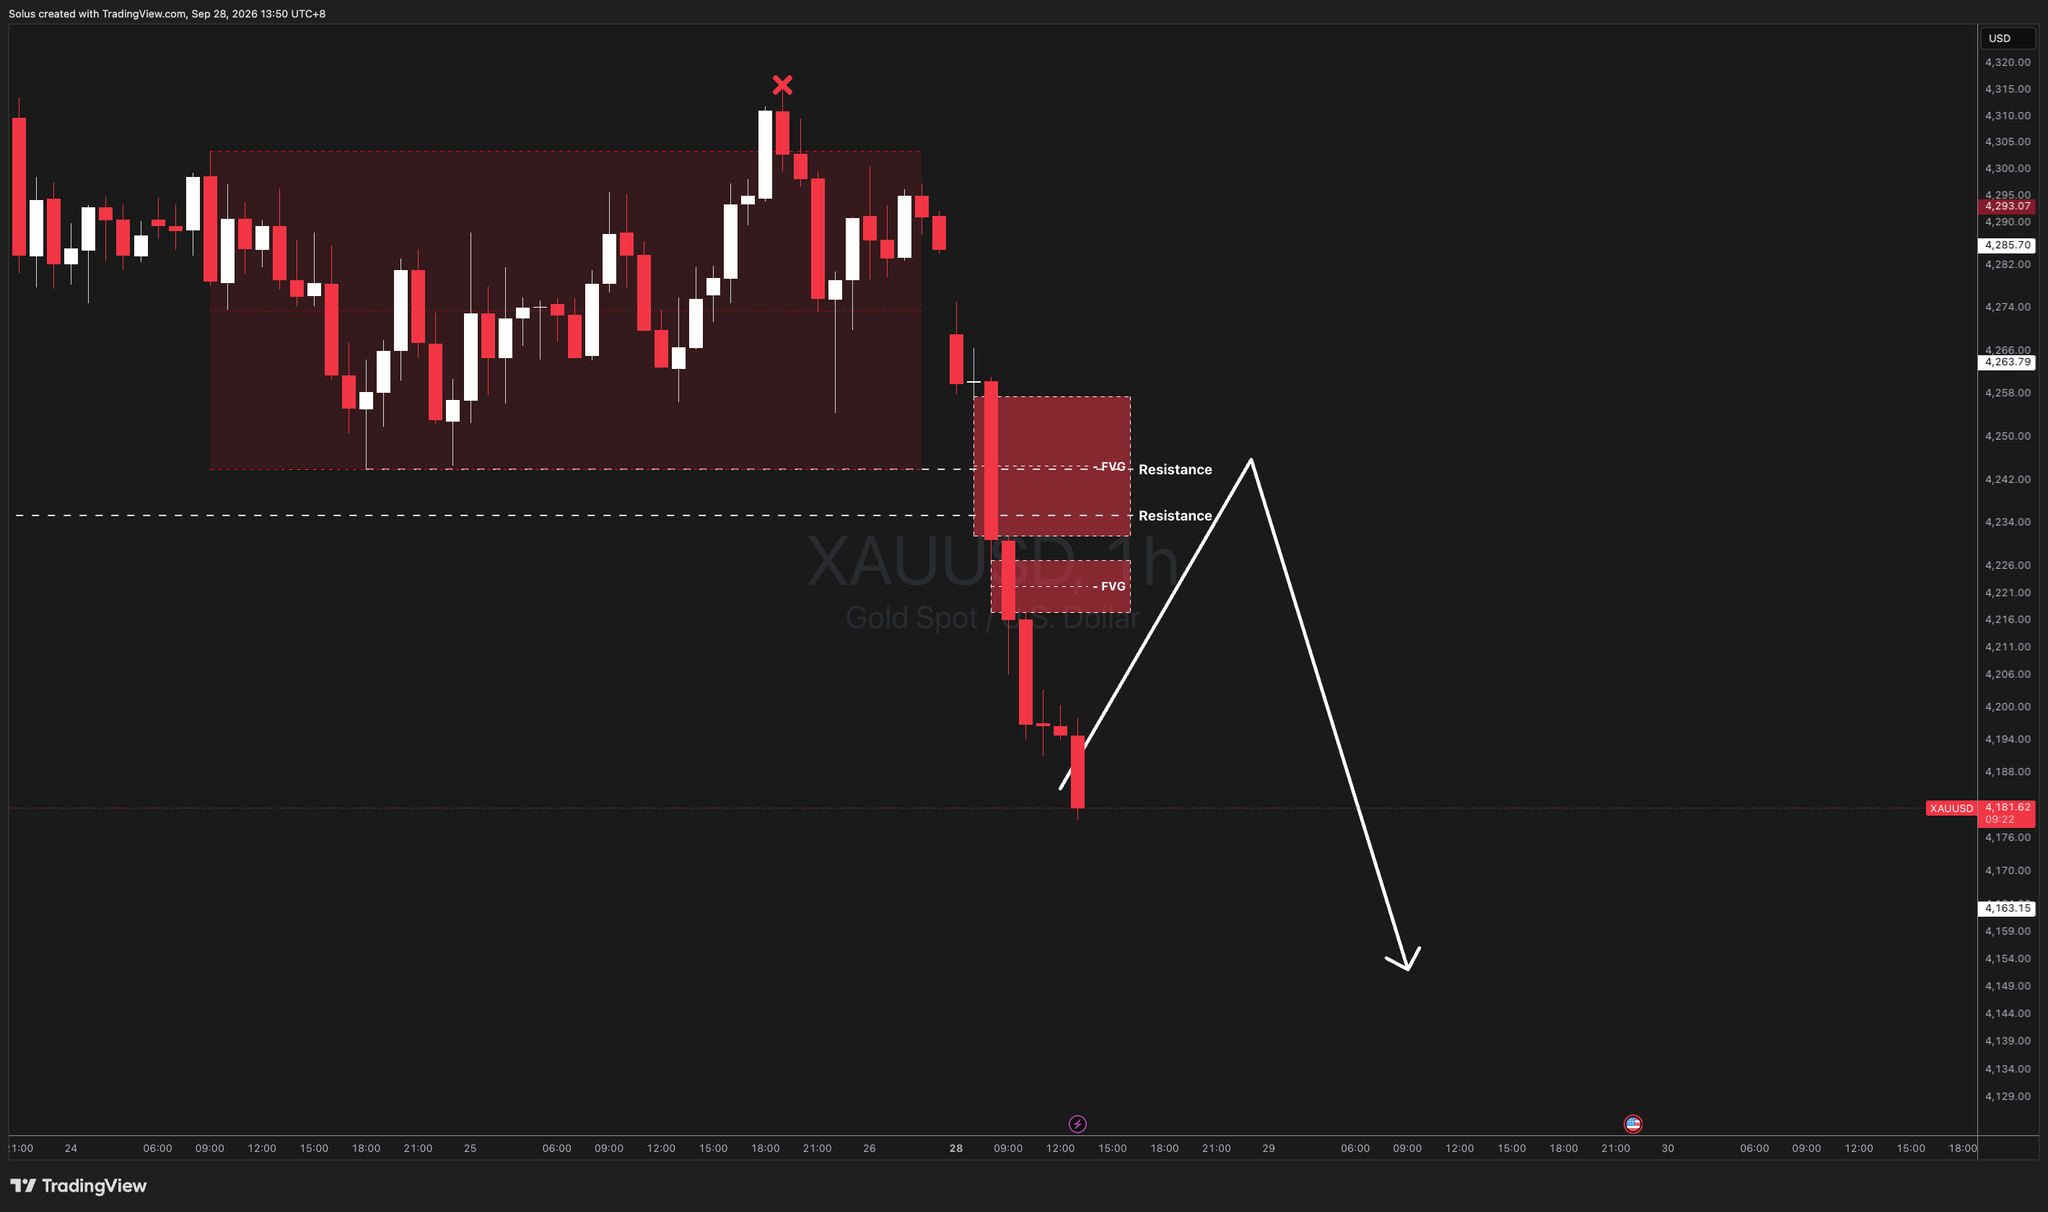
- My map is simple: sell a confirmed break of $4,200, or wait for a bounce to $4,300. Nothing in between.
The only question that matters today
Gold opened the week by falling straight into $4,200. Every plan I have for London starts with whether that level breaks, holds, or fakes a break. This gold price forecast is built around those three outcomes, because the answer changes the trade completely.
What happened since Friday
Last Bias: Bearish | Confidence: Medium.
Friday’s call was to sell a London bounce into $4,300–4,316 and target $4,250. Gold did the job: it made a fresh weekly low below $4,250 that day. On Friday it tried to recover but couldn't get back above $4,300, and it closed the week under that line. The ceiling I flagged held all week, and gold has now fallen through the target I set.
Why it matters
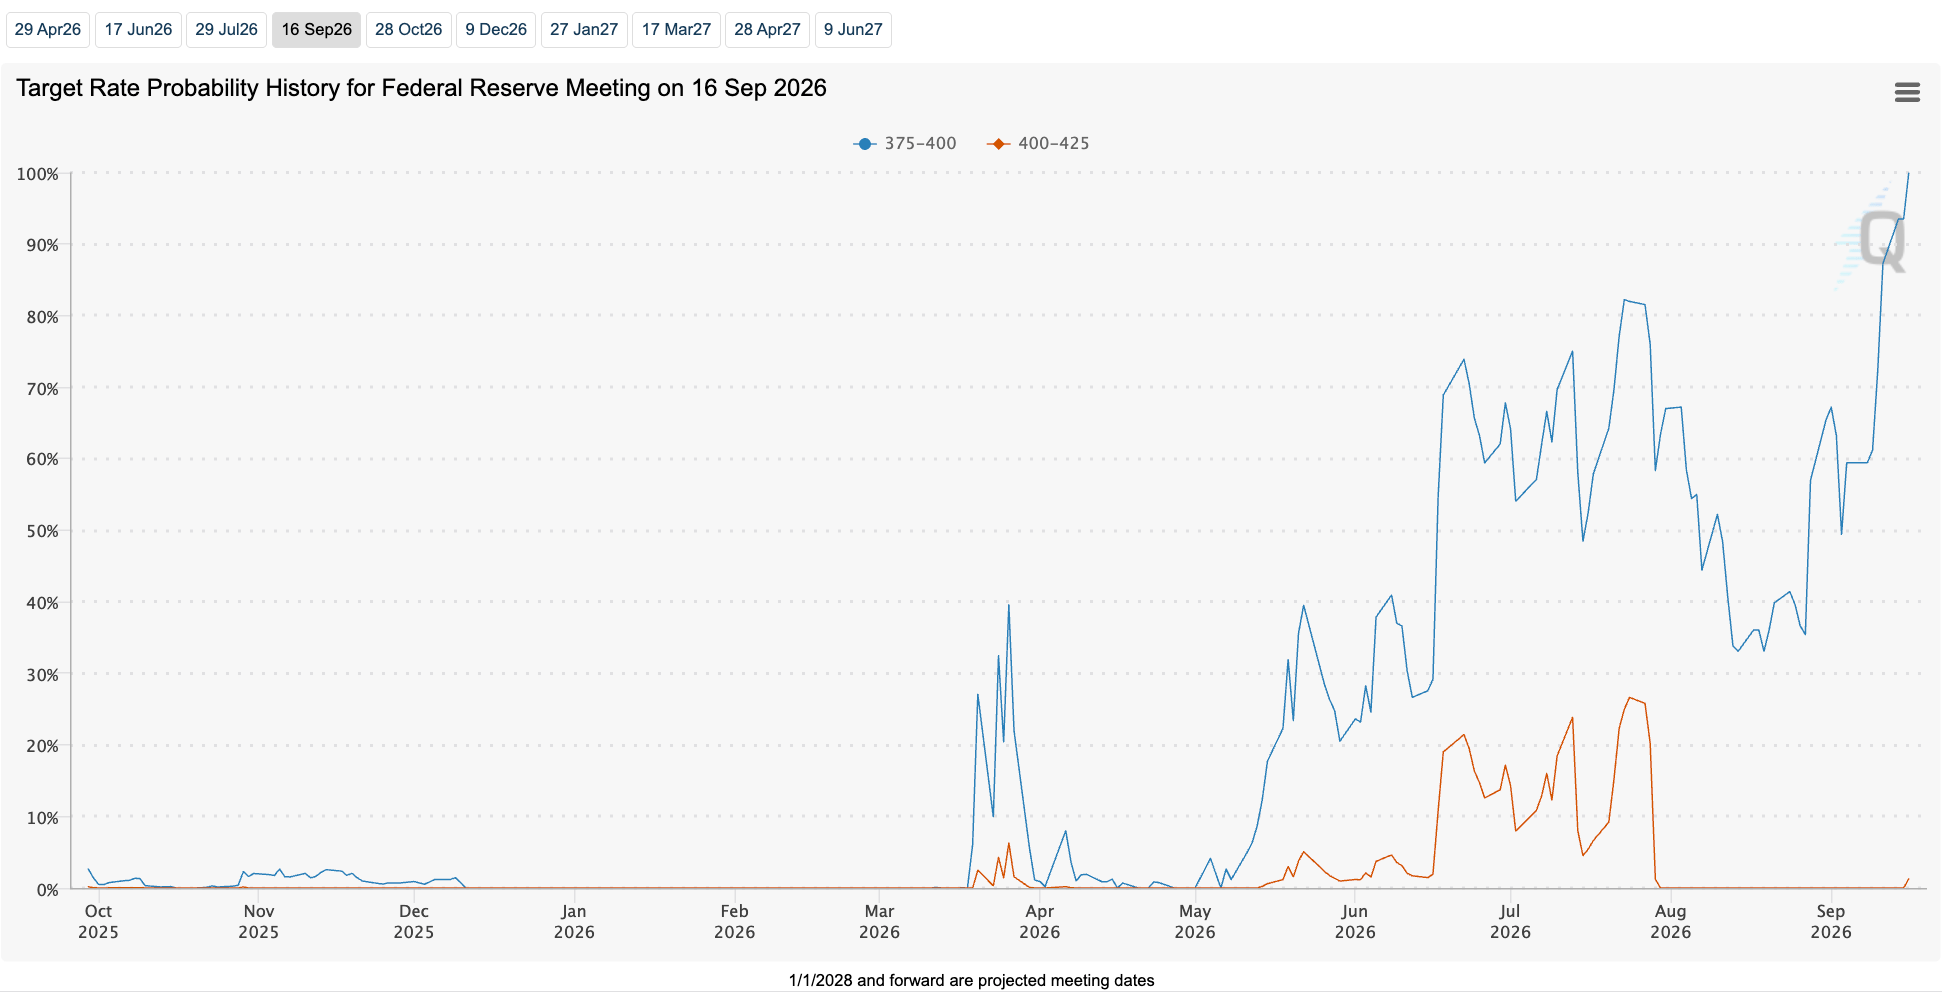
The Fed hiked to 3.75–4.00% on September 16, and 16 of its 18 policymakers expect at least one more hike this year. Markets put the odds of an October move at roughly 66–70%. The 10-year yield touched 5.23% last week, its highest since 2007, and it's back around 5.20% this morning. When bonds pay that much, a metal that pays nothing gets harder to own.
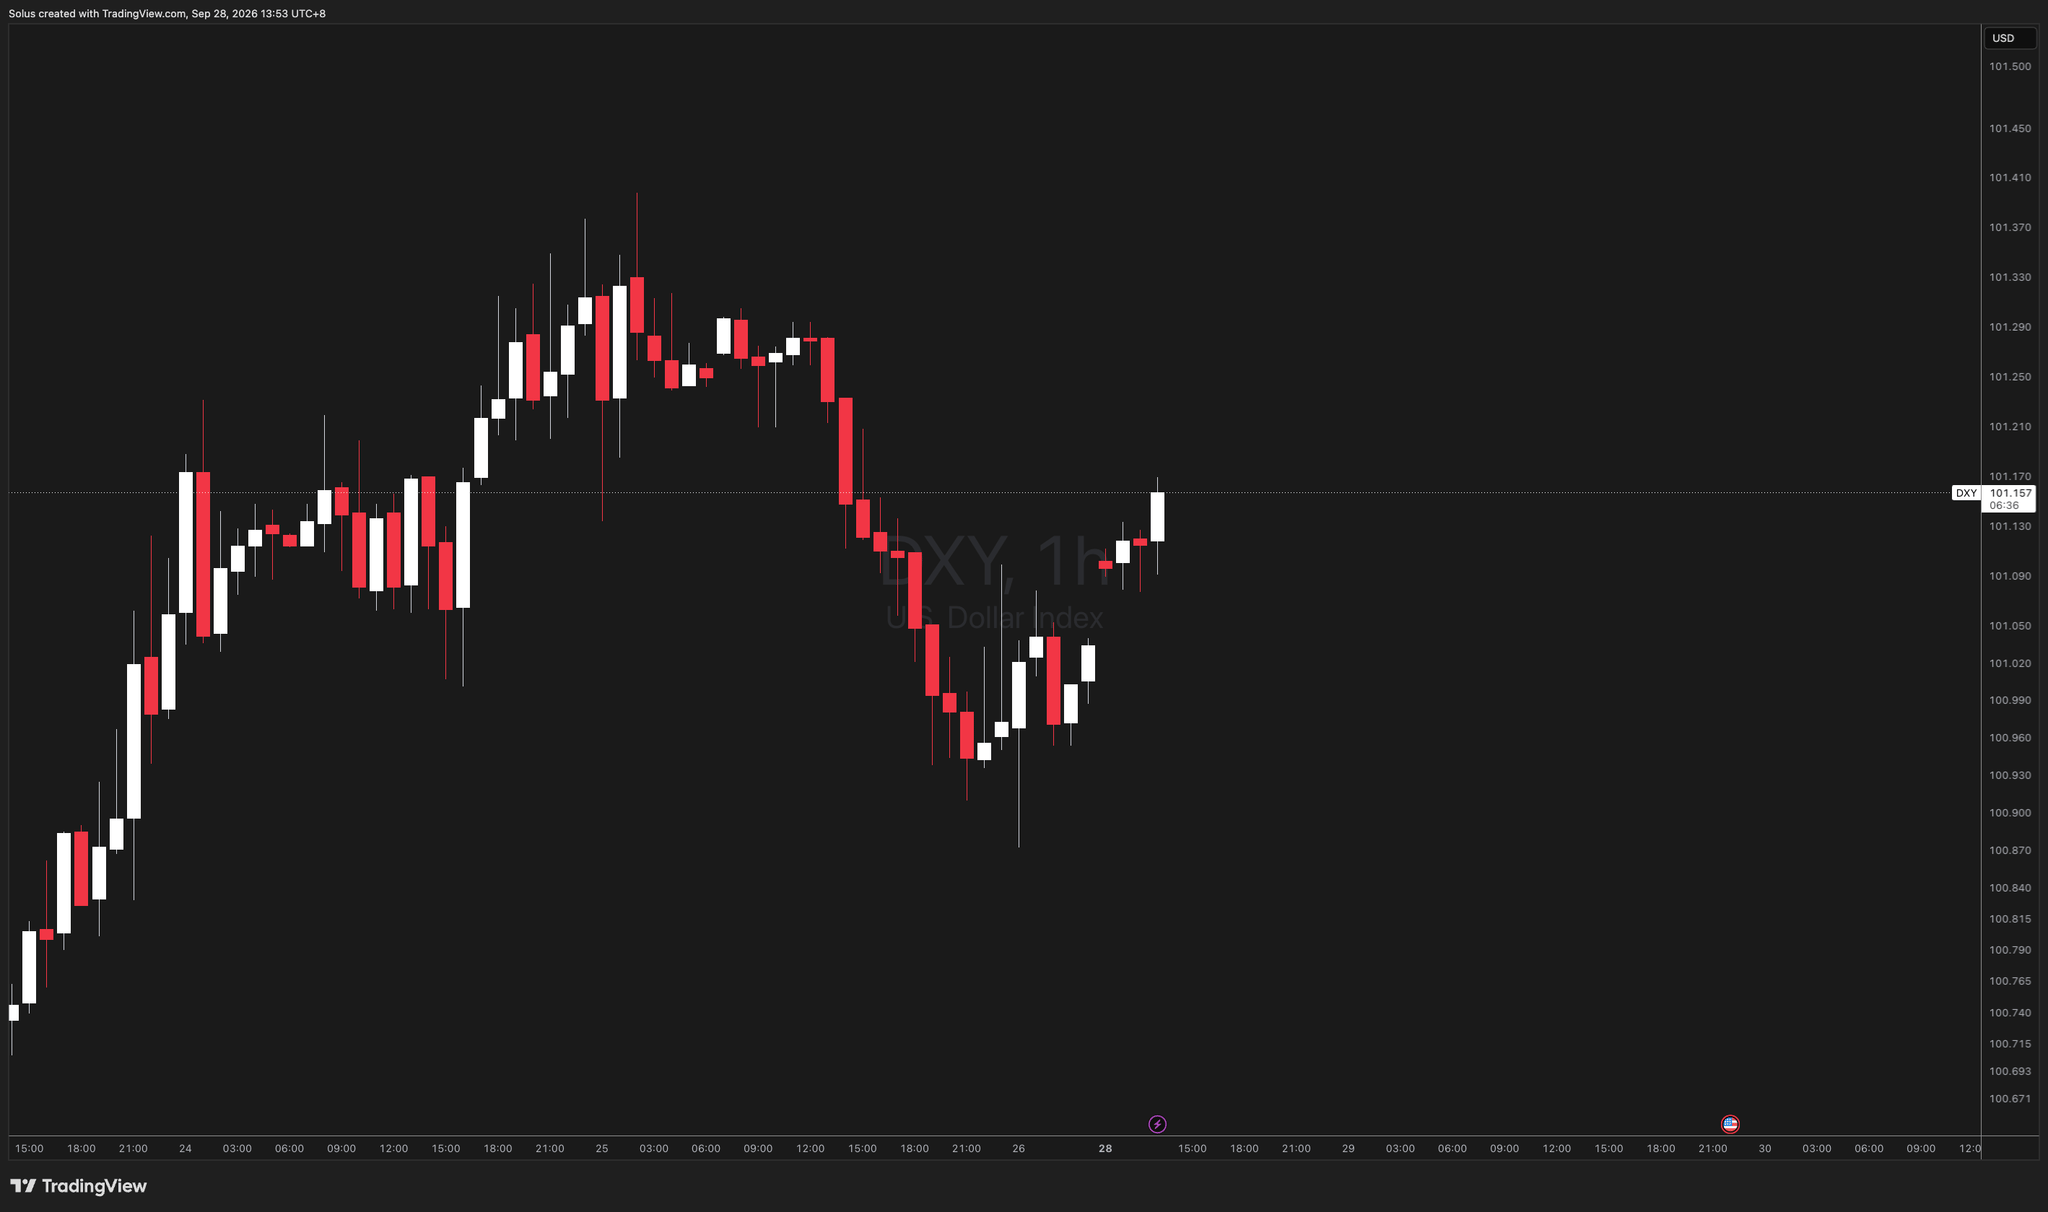
The dollar tells the same story. The US Dollar Index hit about 101.40 on Thursday, a three-month high, and it's holding near 100.85. Vantage has support at 100.59. As long as the dollar stays above it, gold gets no help from the currency side.
Then there's what didn't happen. Over the weekend the Houthis attacked Saudi Arabia, and Trump rejected Iran's offer to reopen the Strait of Hormuz. Oil rose. That's the kind of news that used to lift gold on a Monday. Instead it fell more than 6% from its mid-September high above $4,430. Rates are in charge.
The map
If London... | Then... | I... |
|---|---|---|
Bounces back into $4,200–4,250 and fails there | The old floor is now a ceiling | Sell the failed bounce |
Keeps falling with no bounce | Sellers are still in control, but it's late to join | Don't chase. Wait for a pause and a bounce |
Climbs back above $4,250 and holds | The break was a trap | Stand aside. $4,300 comes back into play |
If the bounce fails
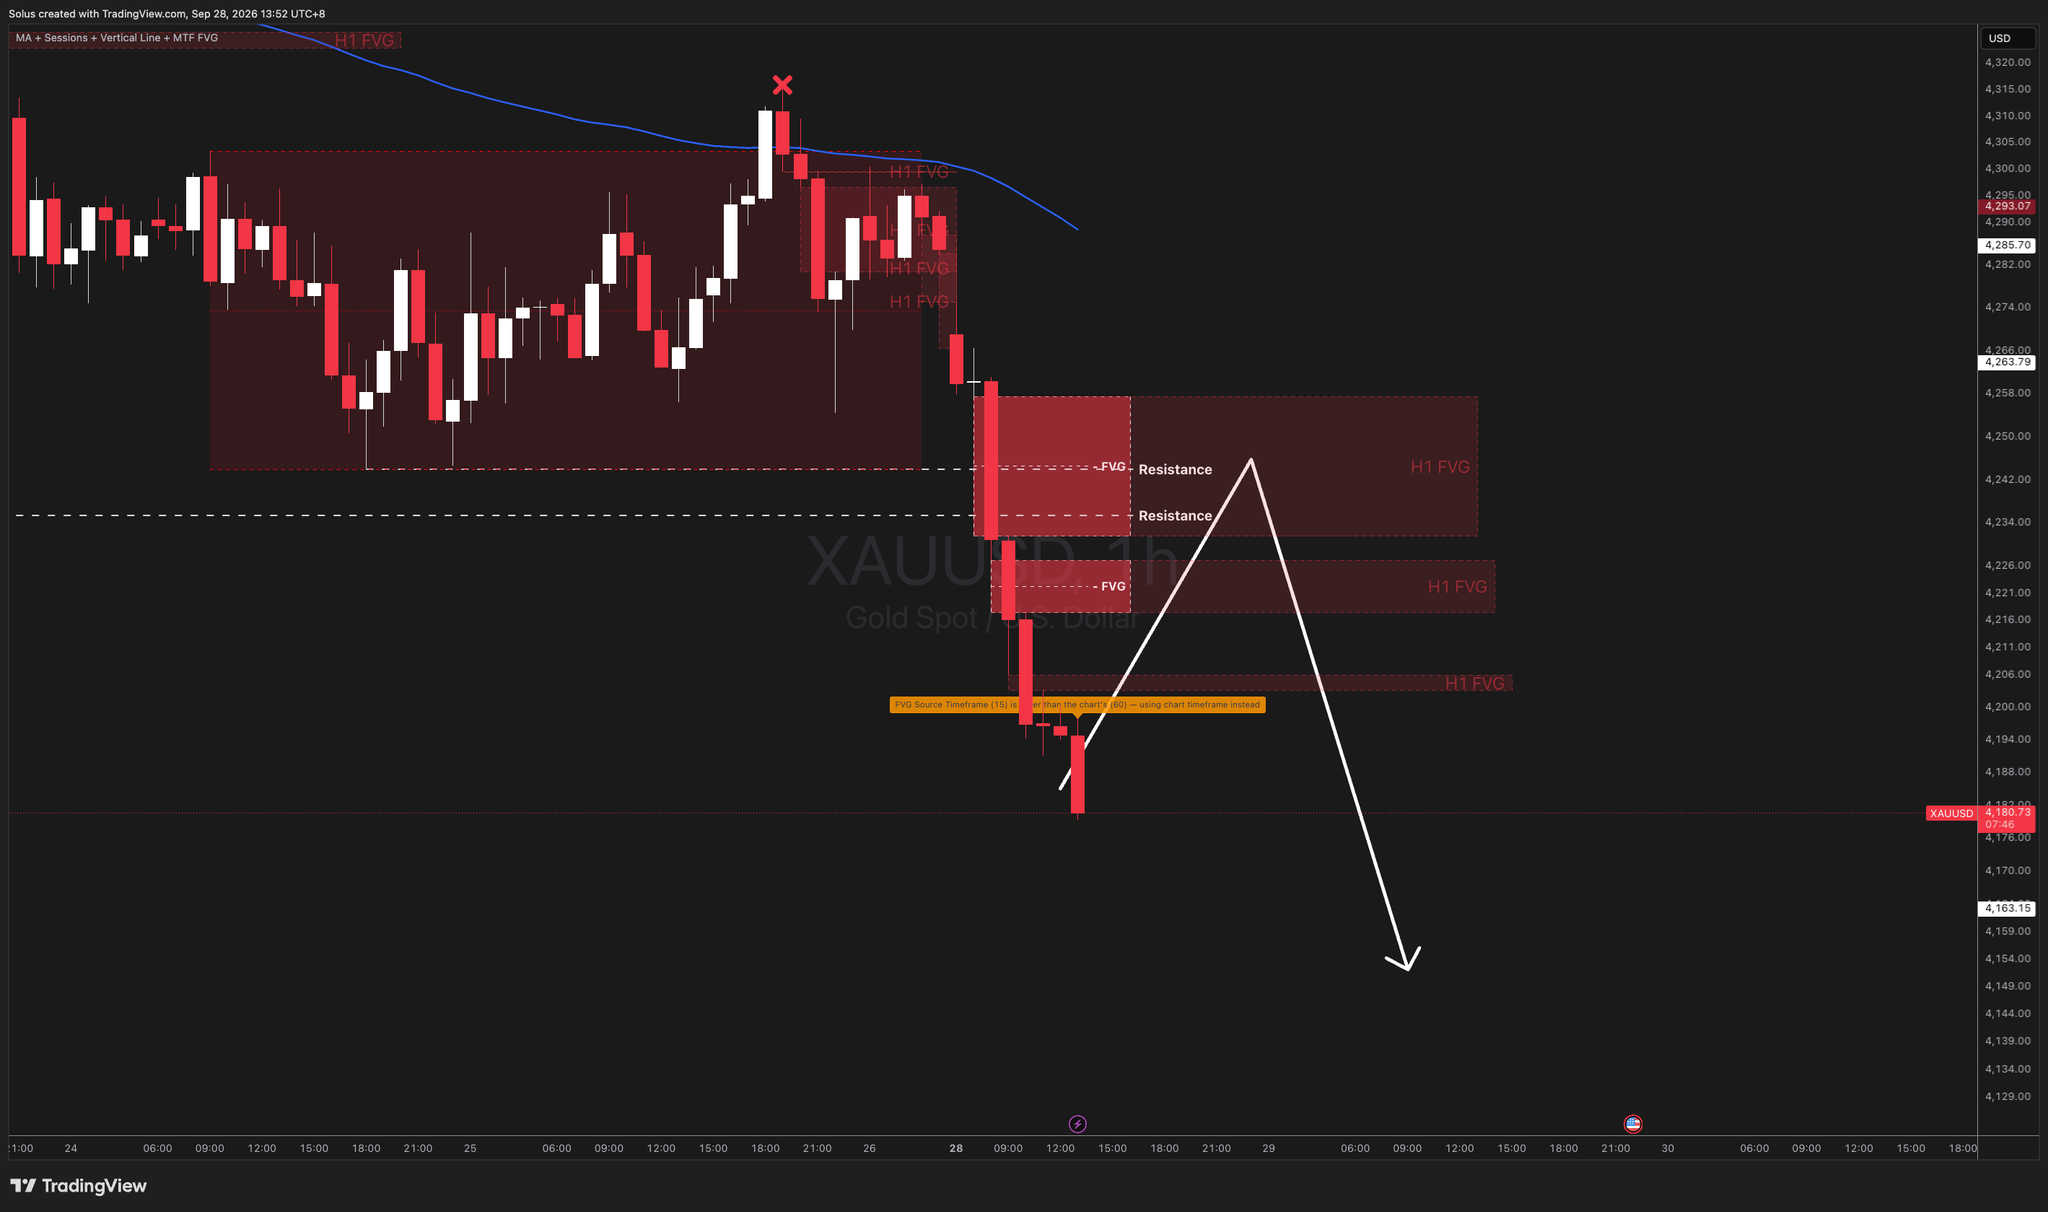
This is the trade I want. The zone between $4,200 and $4,250 held gold up for weeks, and the buyers who defended it are now underwater. When price comes back there, many of them sell to get out. I'm looking for price to stall in that zone and then break a recent low on the 15-minute chart. I enter only after a 5-minute candle fully closes. The first target is $4,130, and $4,000 is the big one if the selling runs. I need the US Dollar Index above 100.59 and the 10-year above 5%.
If It Just Keeps Falling
The hardest thing today is not selling. Price is already moving fast, and selling into a fall that's already more than 6% deep puts the stop far away and the risk in the wrong place. If gold slides straight to $4,130 with no bounce, I let it go. There will be another retest.
If It Climbs Back Above $4,250
A break that can't hold is often a trap. If London pushes back above $4,250 and a 1-hour candle closes there, anyone who sold the break is caught, and the squeeze can run toward $4,300 quickly. I stand aside and reassess near $4,300, where the 100-day moving average sits.
The levels
Level | What it is |
|---|---|
$4,300 | 100-day moving average, and last week's ceiling |
$4,240–4,250 | Broken hourly floor and the 61.8% retracement: the top of the sell zone |
$4,200 | The eight-week floor that broke today: the bottom of the sell zone |
~$4,196 | Where gold is trading now |
$4,130 | First target |
$4,000 | Round number and structural floor |
The calendar
ForexFactory had its filters off, so impact colours didn't show. None of today's events is a red folder, and nothing US-side lands during London.
Event | Currency | Time (ET / PHT) | Forecast | Previous |
|---|---|---|---|---|
BoE's Ramsden Speaks | GBP | 6:00 AM / 6:00 PM | — | — |
Fed's Bowman Speaks | USD | 8:15 AM / 8:15 PM | — | — |
ECB's Lagarde Speaks | EUR | 9:30 AM / 9:30 PM | — | — |
The real events come later in the week: US PCE inflation on Wednesday and US jobs data on Friday at 8:30 PM PHT. Today is a level test, not a data trade.
The real events come later in the week: US PCE inflation on Wednesday and US jobs data on Friday at 8:30 PM PHT. Today is about the break, not the data.
Where I could be wrong
After a fall this steep, a sharp bounce can come at any time. If it comes with the dollar slipping below 100.59, the main reason to sell weakens. An Iran headline could also finally bring buyers back into gold as a safe haven.
The bigger risk sits later in the week. Markets are pricing another hike into a jobs report forecast at just +90,000, with unemployment at 4.1%. A weak number would make an October hike harder to justify, and gold could reverse hard. I don't want to hold a short into Friday's print.
My line in the sand is a 1-hour close back above $4,250. If that happens, I stand aside rather than turn buyer.
Verdict
Bearish, Medium Conviction. The floor broke and the dollar and yields are still against gold, but price is stretched. I'll only sell a failed bounce into $4,200–4,250. No entries in the first 15 minutes of London (3:00–3:15 PM PHT), and no chasing the drop.
Author

Jasper Osita
Independent Analyst
Jasper has been in the markets since 2019 trading currencies, indices and commodities like Gold. His approach in the market is heavily accompanied by technical analysis, trading Smart Money Concepts (SMC) with fundamentals in mind.
















