Gold Price Forecast: Demand for safety maintains XAU/USD near $2,000

XAU/USD Current price: $1,989.35
- The US Dollar advances despite easing government bond yields.
- Dismal US CB Consumer Confidence fuels the gloomy mood in the American session.
- XAU/USD hovers around $1,990 as risk aversion dominates financial boards.
Financial markets turned risk-averse on Tuesday, helping the US Dollar to advance throughout the European session, to later extend gains after Wall Street’s opening. Still, Gold also found demand amid the dismal mood, with XAU/USD currently trading at around $1,990 a troy ounce, after posting an intraday low of $1,976.10.
Financial markets initially bought the Greenback on the back of headlines indicating major central banks would reduce the frequency of their dollar operations with the Fed from daily to once per week, starting May 1, amid better financial conditions. The joint announcement was made by the European Central Bank (ECB), the Bank of Japan (BoJ), the Bank of England (BoE) and the Swiss National Bank (SNB). The soft tone of stock markets also backed the US Dollar, which gathered further momentum following discouraging United States data.
The CB Consumer Confidence Index fell in April to 101.3 from a downwardly revised 104.0 in March. The Present Situation Index increased to 151.1, although the Expectations Index plunged to 68.1. Any reading below 80 is understood as a sign of a near-term recession.
The US Dollar remains strong across the FX board, despite Treasury yields being under pressure. The 10-year note currently yields 3.42%, down 9 basis points (bps), while the 2-year note offers 4.04%, down roughly 10 bps. A firmer Greenback prevents XAU/USD from rallying beyond $2,000.
XAU/USD price short-term technical outlook
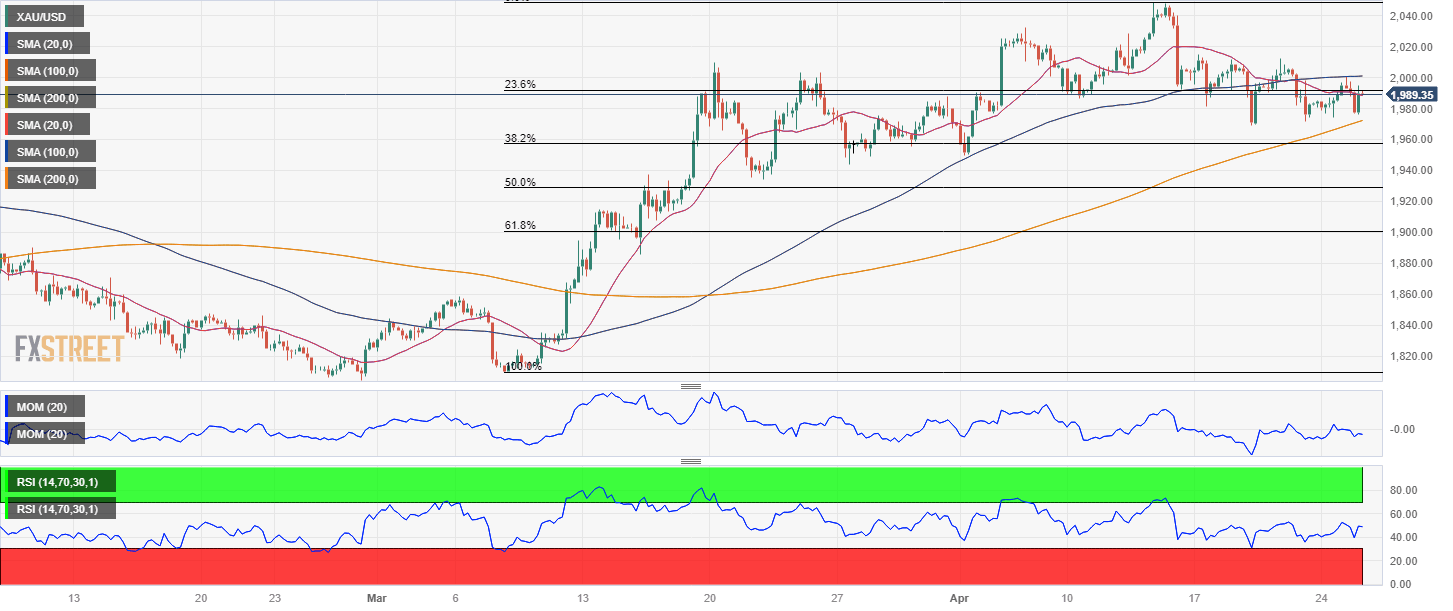
The daily chart for the XAU/USD pair shows it met near-term buyers around the 23.6% Fibonacci retracement of the latest daily advance between $1,809.38 and $2,048.67 at $1,991.80. Also, the 20 Simple Moving Average (SMA) stands directionless just above the latter, reinforcing the static resistance level. At the same time, the longer moving averages maintain their upward slopes far below the current level. Finally, the Momentum indicator accelerated its decline and heads south within negative levels, while the Relative Strength Index (RSI) indicator consolidates around 53. The risk of a bearish leg increased, although, unless XAU/USD breaks below $1,956.50, the movement will be seen as corrective.
In the near term, and according to the 4-hour chart, the pair is neutral-to-bearish. XAU/USD struggles to overcome a mildly bearish 20 Simple Moving Average (SMA), while a directionless 100 SMA remains above it. Technical indicators, in the meantime, have turned marginally higher, but the Momentum is stuck around its 100 level while the RSI stands within negative levels, suggesting limited buying interest.
Support levels: 1,980.80 1,969.20 1,958.64
Resistance levels: 1,991.80 2,015.00 2,028.30
Premium
You have reached your limit of 3 free articles for this month.
Start your subscription and get access to all our original articles.
Author

Valeria Bednarik
FXStreet
Valeria Bednarik was born and lives in Buenos Aires, Argentina. Her passion for math and numbers pushed her into studying economics in her younger years.


