Gold Price Forecast: Covid vaccine optimism threatens XAU/USD’s upward trajectory, what next?
- Gold price stalls the upside, as fresh covid vaccine optimism lifts market mood.
- US dollar attempts a bounce but easing Fed’s tapering expectations keep a lid.
- Gold price will take cues from risk tone and USD dynamics for fresh directives.

Gold price stormed through the $1800 barrier, reaching the highest levels in three weeks at $1806 on Monday. The blistering rally in gold price could be mainly attributed to two factors, with the first one being broad-based US dollar softness amid easing Fed’s tapering expectations. Meanwhile, gold’s safe-haven allure got a boost after concerns intensified over the global economic recovery amid the continuous spread of the Delta covid variant. In fact, the virus concerns have led to watering down of the Fed’s hawkish expectations, weighing on the dollar ahead of this week’s Jackson Hole Symposium. Further, the downbeat US Markit Preliminary Manufacturing and Services PMIs exacerbated the pain in the greenback, strengthening the buying interest around gold price.
This Tuesday, gold price is retreating from multi-week highs, testing the bearish commitments near $1800, as an improvement in the risk sentiment weighs on the safe-haven metal. Markets cheer the renewed covid vaccine optimism after the Food and Drug Administration (FDA) on Monday granted full approval to Pfizer/ BioNTech’s COVID-19 vaccine, making it the first in the US to win the coveted designation. The vaccine approval alleviated the tensions around the Delta variant contagion. The risk-on mood appears to cap the tepid bounce seen in the US dollar while fuelling over a 1% rally in the Treasury yields, which makes the non-yielding gold less attractive.
Next of relevance for gold price remains the US second-tier housing data alongside the incoming covid updates. However, the broad market sentiment and the US dollar price action will remain the key drivers for gold price going forward.
Gold Price Chart - Technical outlook
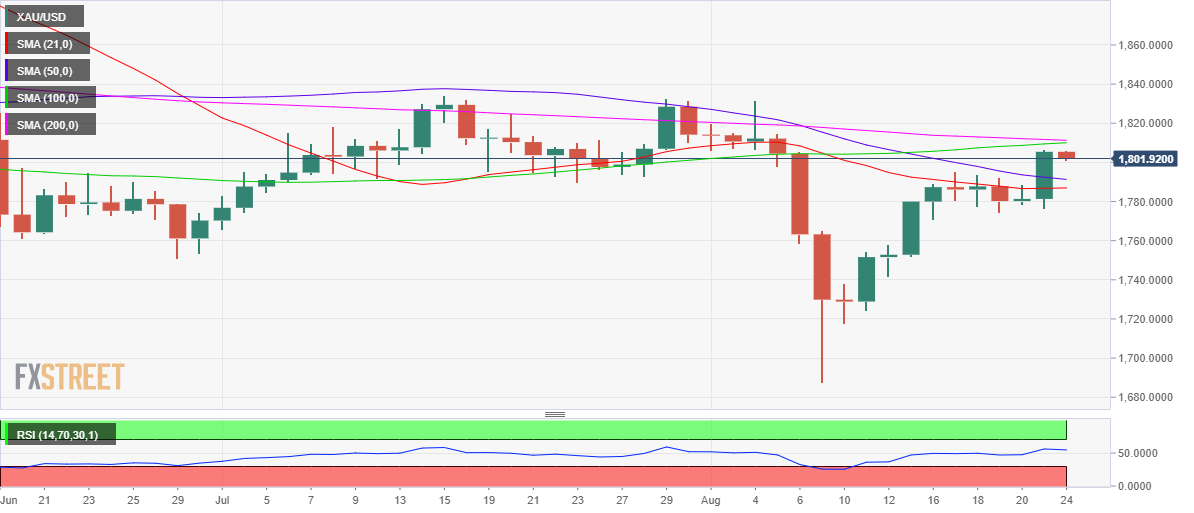
Gold: Daily chart
Gold’s daily chart shows that the upside has stalled just below the powerful hurdle at $1811, which is the confluence of the 100 and 200-Daily Moving Averages (DMA).
If the downside pressure accelerates, gold price could drop further towards the bearish 50-DMA at $1791, below which the horizontal 21-DMA at $1787 could get tested.
The 14-day Relative Strength Index (RSI) has turned lower but holds well above the midline, suggesting that any downside attempts could be temporary.
However, gold bulls will need acceptance above the aforesaid strong resistance at $1811 to unleash additional gains towards the $1820 round figure. The buyers will then target the August highs of $1832.
Premium
You have reached your limit of 3 free articles for this month.
Start your subscription and get access to all our original articles.
Author

Dhwani Mehta
FXStreet
Residing in Mumbai (India), Dhwani is a Senior Analyst and Manager of the Asian session at FXStreet. She has over 10 years of experience in analyzing and covering the global financial markets, with specialization in Forex and commodities markets.


