|

Gold Price Forecast: Bulls side-lined as sentiment leads

XAU/USD Current price:  $1,769.56

  • US Treasury yields jumped to their highest in over three months, fueling demand for the dollar.
  • A scarce macroeconomic calendar leaves financial assets in the hands of sentiment.
  • Gold maintains its longer-term bullish stance but may ease further in the upcoming sessions.
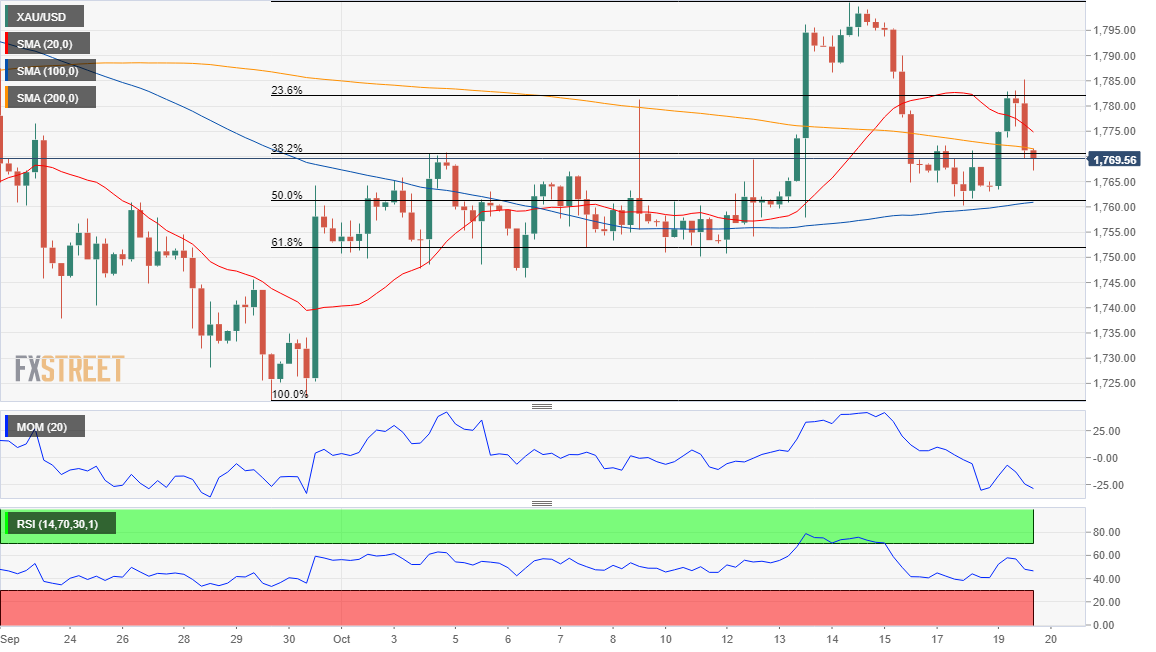
Gold jumped to $1,785.11 a troy ounce during the European session as the dollar came under strong selling pressure. However, the American currency recovered following Wall Street’s opening, as yields are once again on the run. The yield on the 10-year US Treasury note jumped to 1.636%, its highest in over three months and holding on to gains. At the same time, equities are also up, with US indexes nearing record highs. The bright metal trimmed intraday gains and currently trades around 1,769. Meanwhile, the absence of relevant fundamental figures keeps financial assets depending on the sentiment for direction.

Gold price short-term technical outlook

XAU/USD has briefly surpassed the 23.6% retracement of its latest bullish run but is now trading below the 38.2% retracement of the same advance. Ever since the week started, the bright metal has met buyers around the next Fibonacci support level at 1,761.00.  The daily chart shows that the risk is skewed to the upside, although buyers are still cautious.

Gold is trading above a flat 20 SMA, which converges with the mentioned Fibonacci support, while the longer moving averages head south well above the current level. Technical indicators remain within positive levels, with the Momentum advancing and the RSI directionless, suggesting that buyers outpace sellers.

However, the near-term picture favors a slide toward the lower end of its recent range. The 4-hour chart shows that the bright metal is currently trading below the 20 and 200 SMAs, while technical indicators stand within negative levels. The risk should skew to the downside on a break below 1,761.00 the immediate support level.

Support levels: 1,761.00 1,750.00 1,735.80

Resistance levels: 1,770.40 1,777.75 1,790.59

View Live Chart for the XAU/USD

Author

Valeria Bednarik

Valeria Bednarik was born and lives in Buenos Aires, Argentina. Her passion for math and numbers pushed her into studying economics in her younger years.


More from Valeria Bednarik
Share:

Editor's Picks

GBP/USD edges lower as USD steadies above three-month low; downside seems limited

The GBP/USD pair edges lower during the Asian session, and retreats further from its highest level since May 11, touched the previous day. Spot prices slip below the 1.3600 mark in the last hour, though the fundamental backdrop seems tilted in favor of bulls and backs the case for the emergence of some dip-buying.

EUR/USD consolidates near late May highs amid hawkish Fed, Iran risks

The EUR/USD pair enters a bullish consolidation phase after touching its highest level since late May during the Asian session on Thursday. Bulls now await a move beyond the 1.1700 mark before placing fresh bets and positioning for an extension of an over a three-week-old uptrend.

Gold retreats from June highs as hawkish FOMC minutes and US-Iran tensions support USD

Gold eases from its highest level since early June, touched during the Asian session this Thursday, eroding a part of the previous day's strong gains of over 3%. Hawkish FOMC Minutes released on Wednesday, along with persistent geopolitical uncertainties, ease retreating US bond yields-led US Dollar selling bias, which turns out to be a key factor exerting some pressure on the bullion.

Top Altcoins Price Forecast: Ripple rallies above $1, Solana eyes $85, Cardano eases gains

Top altcoins, such as Ripple, Solana, and Cardano, are holding steady on Thursday after a bullish rebound as the broader crypto market rebounds on US Treasury bond buybacks. The technical outlook for XRP and SOL suggests further upside, while ADA risks losing the recent gains. Ripple trades around $1.0951 following a 10% surge the previous day.

$20 billion offered, $2 billion taken: Why Treasury doubled its buyback cap
The US Treasury moved off its own calendar on Wednesday, and that is the part worth sitting with. At 12:32 GMT, the department said it would at least double the size of liquidity support buyback operations in the 10-year to 20-year and 20-year to 30-year sectors, lifting the maximum from $2 billion per operation to at least $4 billion, effective September 9 and running to November 4.
Why is Crude Oil priced for a reopening the ships haven't made?
Fourteen vessels crossed the Strait of Hormuz on Tuesday. Before the war, the count ran near 120 a day. In the sessions since the waterway was publicly declared open, Brent has drifted back to $87 and West Texas Intermediate (WTI) to $81, both a little lower again on Wednesday, with daily momentum on each unwound from the top of its range in late July to the low twenties now.