Gold Price Forecast: Bulls defend the $1,830 price zone

XAU/USD Current price: $1,831.30
- Investors jumped into the US Dollar after returning from the winter holiday.
- Wall Street soared ahead of the opening but turned negative afterwards.
- XAU/USD holds on to modest gains despite being down $20 from its intraday high.
Spot gold started the day on a strong footing, reaching an intraday high of $1,849.99, last seen in June 2022. The sudden demand for the US Dollar mid-European morning saw the bright metal retreat sharply from such a level, now trading at around $1,830, not far from the daily low at $1,827.51.
The Greenback temporarily retreated ahead of Wall Street’s opening but resumed its advance afterwards, as indexes reverted their early momentum and trade in the red. Furthermore, the US Dollar retains its strength despite softer US Treasury bond yields, which stand below Friday’s closing levels.
Fresh flows after the winter holiday period triggered an overdue correction, as the American Dollar has been under selling pressure for the last four months. At this point, it's too early to call for interim tops, as the Greenback may well resume its decline in the upcoming sessions.
XAU/USD price short-term technical outlook
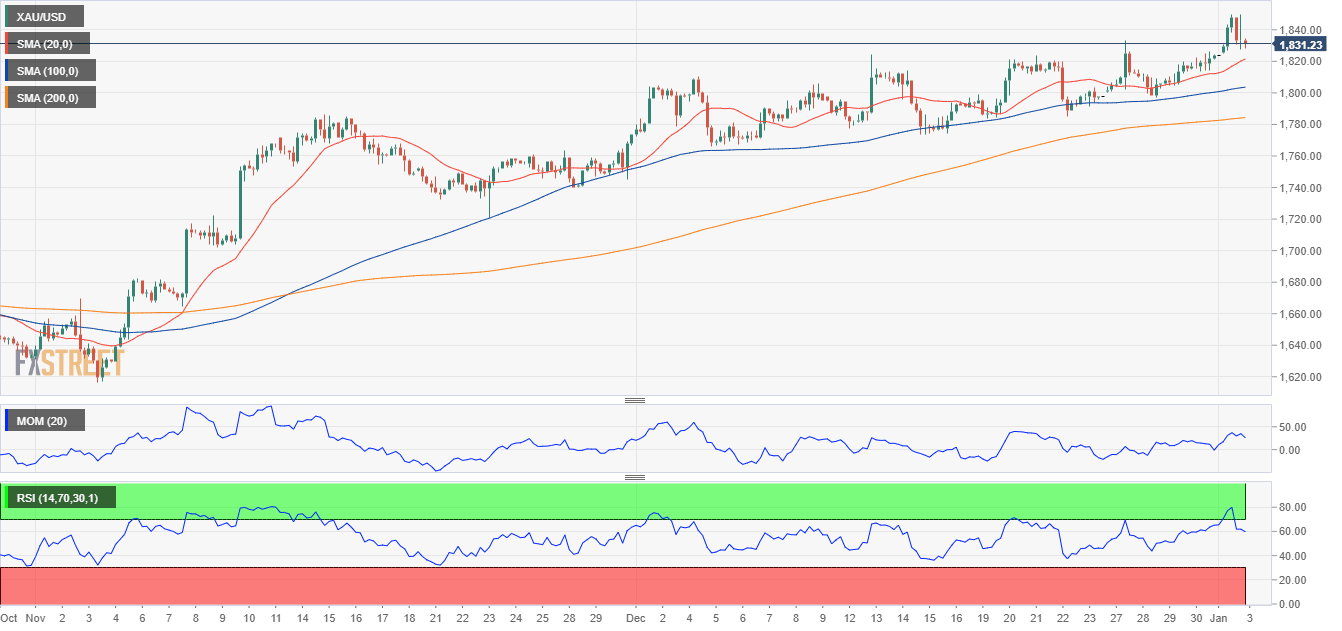
The daily chart for XAU/USD shows that it holds on to modest daily gains despite shedding $20 from its intraday top. The risk remains skewed to the upside according to technical readings, as gold remains above all of its moving averages, with the 20 Simple Moving Average (SMA) maintaining its bullish slope above the longer ones. At the same time, the Momentum indicator turned north within positive levels, while the Relative Strength Index (RSI) advances at around 62, reflecting the dominant upward trend.
The near-term picture suggests XAU/USD could keep declining but also that the bullish trend remains firmly in place. Despite the sharp pullback, the metal remains above bullish moving averages, with the 20 SMA providing dynamic support at around $1,819.30. Technical indicators are retreating sharply from overbought readings but still holding within positive levels and far from their midlines. A break through the mentioned 20 SMA could lead to a steeper decline, but buyers will likely take their chances at around $1,800.
Support levels: 1,819.30 1,806.70 1,793.10
Resistance levels: 1,833.40 1,845.20 1,857.00
Premium
You have reached your limit of 3 free articles for this month.
Start your subscription and get access to all our original articles.
Author

Valeria Bednarik
FXStreet
Valeria Bednarik was born and lives in Buenos Aires, Argentina. Her passion for math and numbers pushed her into studying economics in her younger years.


