Gold Price Forecast 2018: Cautiously bullish, $1200 is the line in the sand

Having hit a low of $1222.50 last Dec, Gold regained poise in January this year, tracking broad based USD weakness and rose to a high of $1357.20 in September.
As of writing, the yellow metal was trading at $1255 levels and looks set to end the year with a 11.8 percent gain (assuming prices do not much in the last two weeks of Dec.)
While the technical charts point to further upside in prices next year, the macro/Fundamentals are on the fence and are providing mixed sentiment in the future.
Focus on monetary policy
Risk of faster Fed rate hikes: Under Powell's leadership the Fed is widely expected to continue gradual normalization of the policy. Traders of US short-term interest rate futures see Fed raising rates only twice next year. But the Fed could hike rates three times in 2018 as the tax reform (repatriation tax) could lead to internationally-held cash flooding back into the US.
A Business Insider report dated Nov. 2, 2017 said, "Goldman Sachs calculated back in September that S&P 500 companies hold $920 billion of untaxed cash overseas, and the firm estimated that $250 billion of that would be repatriated. Looking at all US-based companies, Citigroup says there's $2.5 trillion worth of capital stashed internationally."
The repatriation of funds is not an issue for gold bulls as the greenback won't find fresh bids if the "dollars" held outside US (offshore) and merely brought onshore, i.e. the actual FX conversion (to USD) could be very small, given 50 percent to 80 percent of the overseas cash is held in USD.
However, Fed's response to a repatriation of funds could strengthen the USD and weigh over Gold. Due to a repatriation of funds, there could be an increase in deposits within the US onshore banking system, which could boost the money supply and potentially induce increased lending, thereby reflating the economy. In response, the Fed could tighten the screws at a faster rate and that could yield a short-term drop in gold.
Steepest rate hikes since 2006: A Bloomberg report dated Dec. 11 said, "Wall Street economists are telling investors to brace for the biggest tightening of monetary policy in more than a decade. With the world economy heading into its strongest period since 2011, Citigroup Inc. and JPMorgan Chase & Co. predict average interest rates across advanced economies will climb to at least 1 percent next year in what would be the largest increase since 2006."
Also, Bloomberg Economics predicts net asset purchases by the main central banks will fall to a monthly $18 billion at the end of 2018, from $126 billion in September, and turn negative during the first half of 2019.
The rising interest rate environment is gold negative, although a potential decline in stocks (due to policy tightening) could put a bid under the yellow metal.
Stock market crash unlikely: The sharp rise of US equities has reduced gold's appeal in 2017 and an end to the bull run could boost demand for gold. However, as Mike Shedlock from Sitka Pacific Capital Management explained, a liquidity-driven crash similar to 2008-2009 does not seem likely. Instead, his model suggests we could face a long drawn-out decline over many years similar to events in Japan. So, a surge in gold can be ruled out, however, the slow decline in the stocks could ensure the metal defends the major support level of $1200.
The World Gold Council is bullish on gold - The latest report by the World Gold Council (WGC) maintains the precious metal has many reasons to stretch its gains into 2018. WGC believes the monetary policy tightening will be gentle given the subdued inflation across the advanced world. Further, it says geopolitical tensions could push up metal from time to time.
Meanwhile, Indian demand for gold could increase in 2018. Somasundaram PR, Managing Director (India), WGC, while speaking to BusinessLine said, "in the Indian context, the demand will bounce as rural income is set to grow. The government’s vision to double farmers’ income by 2022 will lead to a sharper increase in rural gold demand. We do not believe that India’s annual gold demand will be limited to 650-750 tonnes. It will bounce back to 850-950 tonnes in another 18 months."
It is quite clear that monetary policy will continue to be a significant driver of gold demand in 2018. As discussed above, the market stands divided on the pace of monetary policy tightening. The WGC believes the policy tightening would be gentle (due to low inflation), thus gold could remain well bid in 2018.
I believe the policy tightening could gather pace across the advanced world in 2018 and end up pushing gold higher contrary to popular belief that contractionary monetary policy is bearish for gold.
This is because the unprecedented monetary policy stimulus post-2008 crash led to asset price inflation (and not real economic inflation). Thus, gold fell from the record highs above $1900 (2011 high) to $1050 in Dec. 2015.
Now that the central banks are likely to unwind the unprecedented stimulus at a faster pace, the resulting slow asset price deflation could push gold higher.
Technicals - Bulls need to defend $1200
Monthly chart
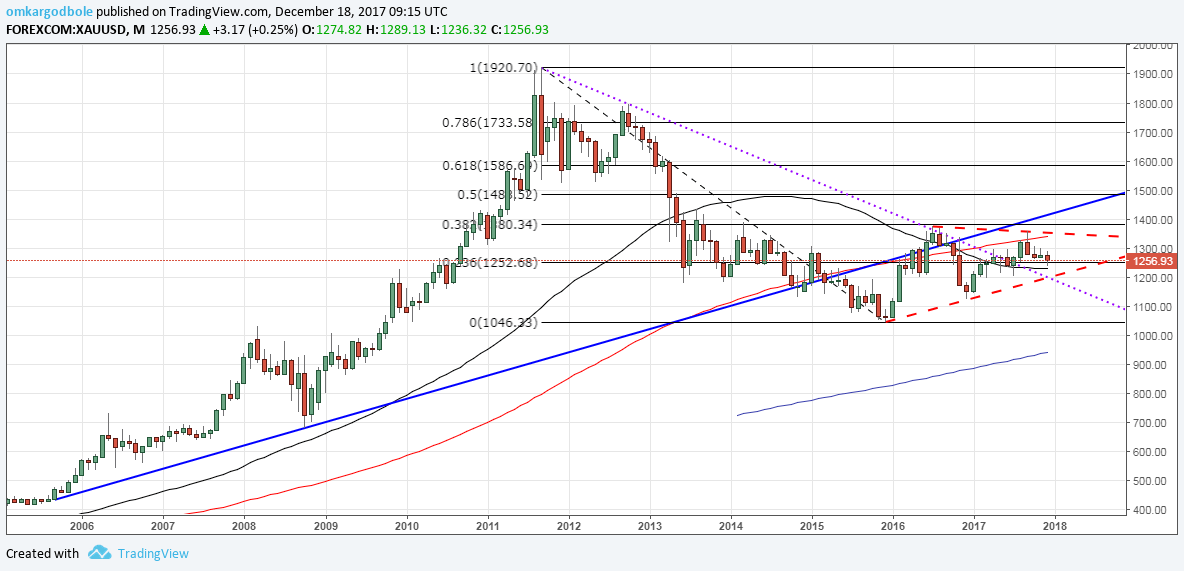
The above chart shows:
Rising lows pattern - (Dec. 2015 low of $1046.33 and Dec. 2016 low of $1122.77).
The trendline sloping lower from Sep. 2011 high and Oct. 2012 high has been breached in July this year.
100-MA is still sloping upwards, while the 50-MA has bottomed out.
Symmetrical triangle pattern - Resistance is seen at $1351, Support is seen at $1200
Gold prices are holding above $1252.68 (23.6% Fib R of 2011/2015 sell-off).
The moving averages favor the bulls. Also, the higher lows pattern, breach of the descending trend and a move above the 23.6% Fib retracement indicates the sell-off from the 2011 high has ended in Dec. 2015 at $1046.33. The tables have turned in favor of the bulls and prices could test $1350 levels, if the metal ends January, 2018 on a positive note.
Weekly chart
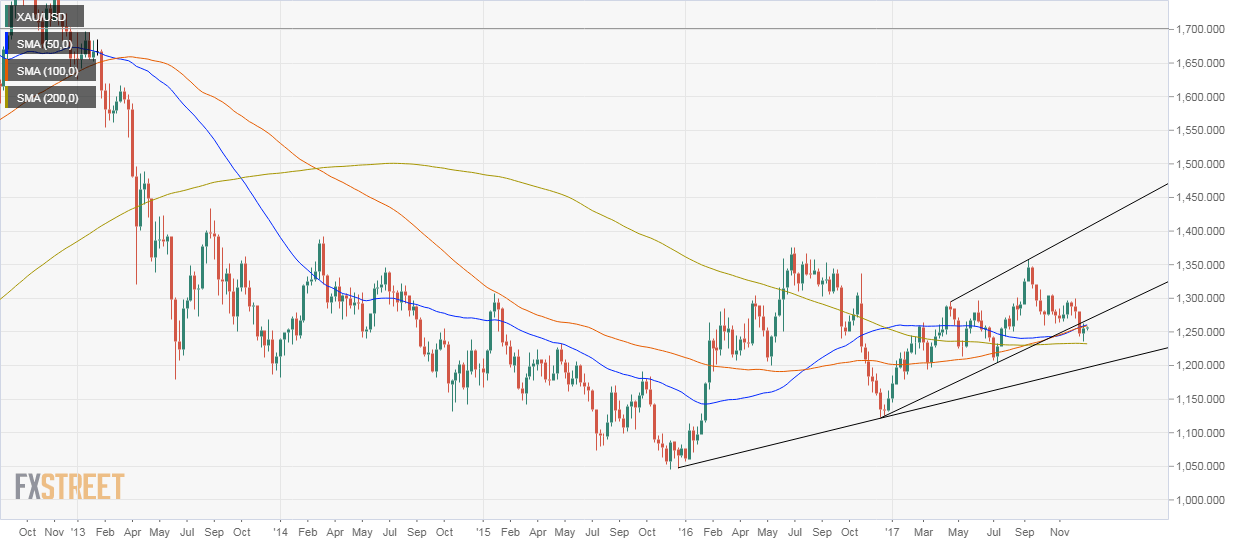
The above chart shows:
Price may have suffered a downside break of the rising channel, but the higher lows pattern is still intact.
More importantly, the price action since late 2013 looks like a nice rounding bottom formation.
Cleary, the weekly chart points to better days ahead for the bulls, especially if gold strengthens in January 2018.
A bullish break of the symmetrical triangle would open doors for $1430 (resistance offered by the trend line sloping upwards from Sep. 2005 low and Oct. 2008 low) and $1488 (50% Fib R of 2011/2015 sell-off).
On the other hand, a monthly close below $1200 (bearish breakdown of a symmetrical pattern) would signal a continuation of the sell-off from the 2011 high of $1920.70. In such a case, prices could revisit $1046.33 (Dec. 32015 low).
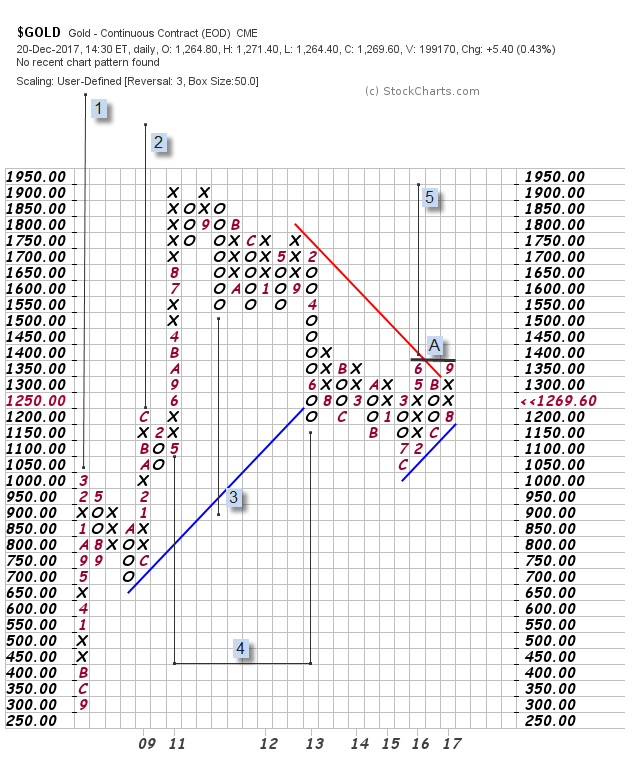
Gold Point & Figure Chart

As far as the broader trend is concerned, the price structure on a 50-$ box chart is indicative of a corrective retracement in a larger bull market. The remarkable rise from the 300.00 dollars per ounce of gold almost 15 years ago, makes P&F analysts go with the premise that this market will seek new record highs in the future. Counts 1 and 2, pointing at 2550.00 and 2200.00, are supportive of this view.
At the same time, a sustained close below the 45º degree line (blue) would imply a resumption of the corrective action with counts 3 and 4 targeting 850.00 and subsequently 450.00. Nevertheless, the potential double-top (labeled A) and break of the descending 45º line (red) is already threatening to invalidate the bearish targets, and thereby add credence to count 5 with a minimum objective of 1950.00.
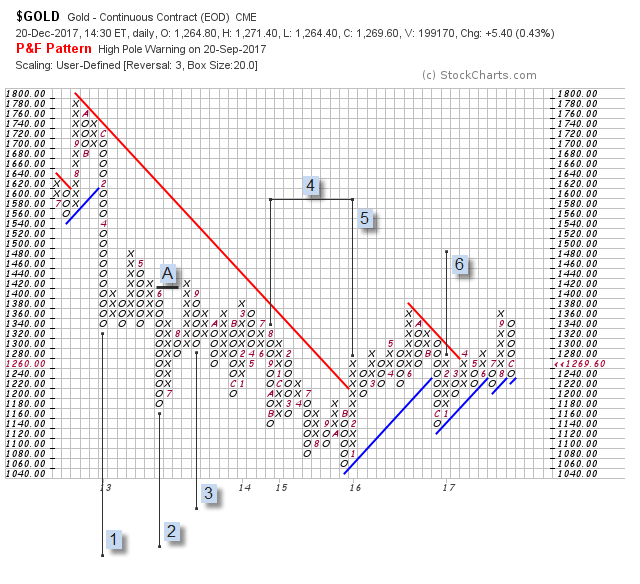
On a smaller box size, we can find an established and unfilled count (1) at 580.00, another at 700.00 which has been invalidated with the surge to 1400.00 (in A), and a third count (3) pointing at the 1000.00s which has its invalidation point precariously close at 1420.00. Contradicting signals started to form in 2014 and 2015, making the already weakened bearish picture even less probable. Counts 4 and 5 are indicative of a potential rise to 1660.00 and 1500.00 and count 6 at 1480.00, supported by a series of 45º degree bullish lines, all together reinforcing the idea the bull trend could continue in 2018.
Author

Omkar Godbole
FXStreet Contributor
Omkar Godbole, editor and analyst, joined FXStreet after four years as a research analyst at several Indian brokerage companies.


