Gold Price Forecast: 100 DMA appears a tough nut to crack for XAU/USD sellers
- Gold price is again finding demand at the key 100-Daily Moving Average.
- BoC surprise rate hike implies a Federal Reserve that may not see an end to its tightening cycle.
- Uptick in the daily RSI justifies the Gold price rebound; will it last?

Gold price is attempting a bounce from near the $1,940 region early Thursday. Gold price shredded 1% in Wednesday’s trading after the US Treasury bond yields spiked on the surprise rate hike decision announced by the Bank of Canada (BoC), following a pause since March.
Federal Reserve pause bets trimmed on Bank of Canada’s surprise hike
The United States Dollar (USD) witnessed intense volatility and swung on both sides on Wednesday, eventually settling the day almost unchanged. However, the chief driver for Gold price was the US Treasury bond yields, which saved the day for the Greenback bulls.
Despite cautious optimism in the first half of the day, the US Dollar lost its footing, motivating Gold bulls to rechallenge the $1,970 level. But the Bank of Canada’s (BoC) surprise 25 basis points (bps) rate hike to 4.75% helped markets pare back a June Federal Reserve rate hike pause expectations.
The BoC's hawkish surprise reminded markets that a Fed pause next week doesn’t mean an end to its tightening cycle. Market pricing for a June Fed pause dropped to 63% vs. a 75% probability seen before the BoC policy announcements.
This triggered a sharp rally in the US Treasury bond yields across the curve, lifting the US Dollar at the expense of the Gold price. The benchmark 10-year US Treasury yields jumped 12 bps to hit fresh weekly highs at 3.80%.
So far this Thursday, Gold price is consolidating the previous sell-off amid a pause in the US Treasury bond yields upsurge. Should the mood worsen in the day ahead, the US Dollar will likely attract safe-haven flows, which could cap the rebound in Gold price. However, the continued weakness in the US Dollar on potentially weak US Jobless Claims could lend additional support to the rebound in Gold price.
Gold price technical analysis: Daily chart
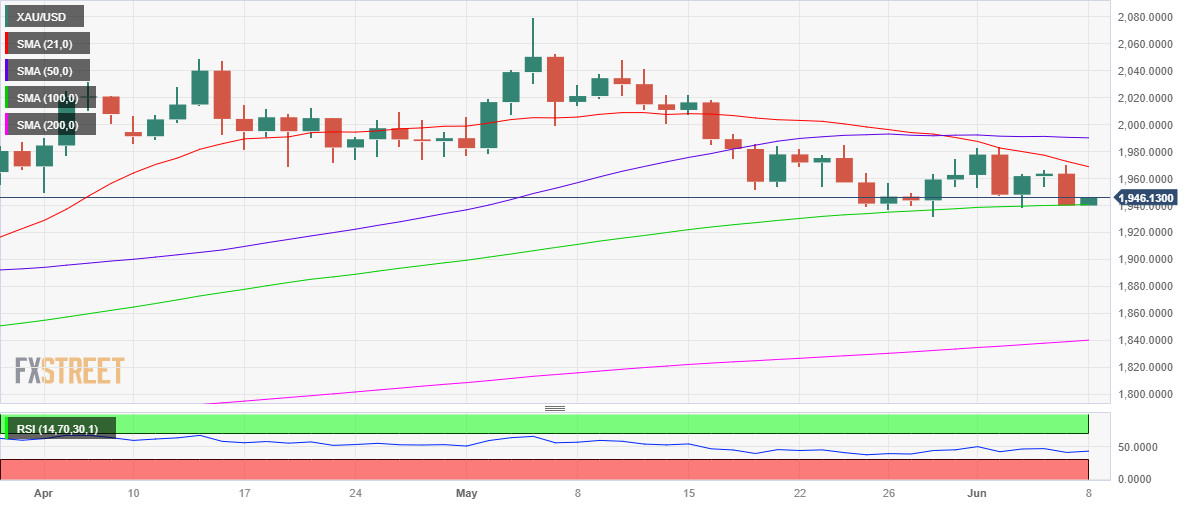
There seems to be no change to the short-term technical outlook for the Gold price, as the range play is likely to extend so long as the Gold price remains between the two key Daily Moving Averages (DMA), the 21 and the 100, now at $1,969 and $1,940 respectively.
The 21 and 50 DMA Bear Cross continue to limit the upside attempts in the Gold price. Despite the 14-day Relative Strength Index (RSI) uptick, the gauge still holds below the 50 level, adding credence to the bearish bias.
Gold bears need a daily closing below the 100 DMA support to stretch the correction toward the previous week’s low at $1,932, below which the March 17 low of $1,918 will be tested.
Conversely, the Gold price rebound could gather steam only on recapturing the downward-pointing 21 DMA at $1,969. Further up, the flattish 50 DMA at $1,990 could offer stiff resistance to Gold buyers.
The next relevant upside target for Gold optimists is envisioned at the $2,000 psychological level.
Premium
You have reached your limit of 3 free articles for this month.
Start your subscription and get access to all our original articles.
Author

Dhwani Mehta
FXStreet
Residing in Mumbai (India), Dhwani is a Senior Analyst and Manager of the Asian session at FXStreet. She has over 10 years of experience in analyzing and covering the global financial markets, with specialization in Forex and commodities markets.


