Gold outlook: Gold bulls take a break

Gold bulls took a breather last week and today we are to take a look at the main fundamental issues, tantalizing its price action currently and in the coming week. For a rounder view we intend to conclude the report with a technical analysis of gold’s daily chart.
Gold’s negative correlation with USD in place
Over the past five days, the negative correlation of the USD with gold’s price seems to be in place. It’s characteristic how the USD Index rose on Wednesday, Thursday and Friday, while gold’s price dropped and vice versa, the USD Index rose on Monday while gold’s price dropped. The observation of the movement of the two prementioned trading instruments highlights that the negative correlation is currently in place and could be maintained in the coming days. Yet we issue a warning for a possible decoupling of the two trading instruments should safe haven flows be so strong that affect both of them simultaneously. Furthermore, we also note that US bond yields continued falling over the past week, as the investors' increasingly pessimistic sentiment about US economic outlook appears to be driving them lower. Our worries for the outlook of the US economy intensified after the release of the Atlanta Fed GDP yesterday, which is forecasting a steep contraction of the US economy in Q1 25, of -2.8%, while the ISM manufacturing PMI figure for February yesterday also dropped. Please note that the ISM non-manufacturing PMI figure is to be released on Wednesday and may draw the markets attention.
Trump goes ahead with tariffs and the Ukraine minerals deal falls through
Ona fundamental level, we note that the Trump administration, proceeded with the application of import tariffs of 25% on Canadian and Mexican products and additional 10% on Chinese products. This on/off approach by Trump in imposing the tariffs, is understandably a bargaining chip, as the tariffs are being economically weaponized, yet tend to create substantial uncertainty regarding their possible effects on the US and global economic outlooks. We expect targeted countries to respond possibly in kind, or divert their exports from the US to other economies, while the US may expand the list of products or countries of origin to impose tariffs. The stakes are high about the issue and uncertainty about further developments are also high, which in turn could shake gold’s price depending on whether we see further frictions building up.
Sticking with Trump related issues, one cannot pass by the heated discussion in the oval office of the White House, between the Ukrainian President Zelenskyi and the US President and Vice President. The discussion resulted in the Ukrainian minerals deal not being signed, while the US has US suspends all military aid to Ukraine. The uncertainty about the issue is also high, hence should we see it intensifying, we may see gold’s price getting some support and vice versa.
US Financial releases ahead
Next Friday we highlight the release of the US employment report for February. Currently forecast, show an expected drop of the Non-Farm Payrolls (NFP) to rise to 160k if compared to January’s 143k, the unemployment rate to remain unchanged at 4.0% and the average earnings growth rate to also remain unchanged at 4.1%yoy. Should the actual rates and figures meet their respective forecasts, we may see the rise of the NFP figure and the stability of the unemployment rate, exciting traders and thus providing some slight support for the USD, i.e. weighing on the gold’s price. Yet the actual rates and figures seldomly meet their forecasts, a possible loosening US employment market may provide some support for gold’s price while on the flip side a possible tightening US employment market could weigh on the precious metal’s price. Given the importance of the release of February’s US employment report, we also note the release of the ADP national employment figure for February on Wednesday which may be considered by some traders as a prelude for Friday’s NFP figure.
Technical analysis
XAU/USD 4H chart
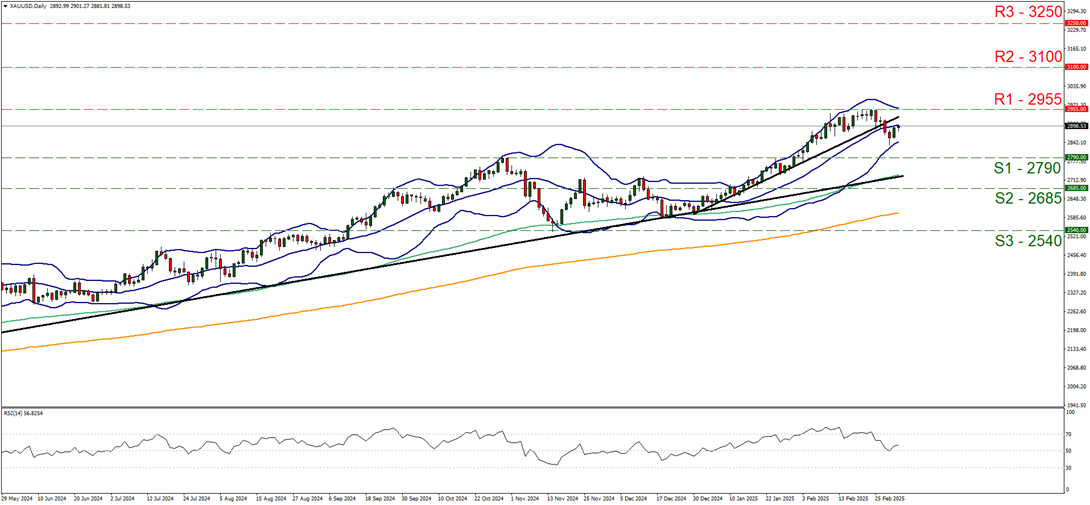
Support: 2790 (S1), 2685 (S2), 2540 (S3).
Resistance: 2955 (R1), 3100 (R2), 3250 (R3).
Gold’s price corrected lower after hitting an all time high on the 2955 (R1) resistance line, last Tuesday and tended to remain between the R1 and the S1. Given that the precious metal’s price action in its correction lower on Wednesday, has broken the upward trendline guiding it since the 13th of February, hence we switch our bullish outlook in favour of a sideways motion bias for the time being. Also the RSI indicator has corrected lower touching the reading of 50 on Friday and risen a bit on Monday reflecting some bullish tendencies, yet remains unconvincing currently for a bullish market sentiment of market participants. Furthermore, we also note that the Bollinger bands are narrowing, implying less volatility for gold’s price which could allow the sideways motion to be maintained. For a renewal of the bullish outlook, we would require gold’s price to break the all-time record high 2955 (R1) resistance line, with the next possible target for the bulls being set at the 3100 (R2) resistance barrier. On the flip side, should the bears take over we may see gold’s price breaking the 2790 (S1) support level and start aiming for the 2685 (S2) support base.
Author

Peter Iosif, ACA, MBA
IronFX
Mr. Iosif joined IronFX in 2017 as part of the sales force. His high level of competence and expertise enabled him to climb up the company ladder quickly and move to the IronFX Strategy team as a Research Analyst. Mr.
















