XAU/USD outlook: Could the November US inflation report and China alter Gold’s direction?

Gold’s price appears to have had some slight bullish tendencies yesterday and during today’s Asian session, yet nothing as convincing yet. In today’s report we intend to have a look at the upcoming release of the US Inflation report for November, China’s intentions and geopolitical issues in the Middle East, all on a fundamental level for the gold market. For a rounder view, we conclude the report with a technical analysis of gold’s daily chart.
November’s US inflation data
We make a start with US financial releases by noting that the release of the US employment report for November on Friday showed a hotter than expected US employment market as the NFP figure rose surpassing market expectations, yet the tick up of the unemployment rate may have clipped the market’s enthusiasm. The data had little effect on gold’s price at the time of the release, implying that a trader should look for other fundamental issues. Yet the release of the November US inflation report may not be the same case as gold is also used as a hedging trading instrument against inflation. Please note that for the time being the headline rate is expected to tick up and the core rate to remain unchanged at relatively high levels, both on a year on year level. Should the actual rates meet their respective forecasts, we may see the Fed’s stance turning more hawkish given also the strong US employment report for the same month. Should we see the US CPI rates showing a persistence or even an acceleration of inflationary pressures in the US economy we may see the release weighing on gold’s price and vice versa. Also please note that we see the case for the negative correlation of gold with the USD as having been interrupted. Its’ characteristic that gold’s price remained stable on Friday while the USD rose, while yesterday and during todays’ Asian and early European session both trading instruments were on the rise. Also US yields since our last report dropped up until yesterday, also highlighting the interruption of the negative correlation of gold with US yields, once again implying that gold traders should elsewhere for fundamental factors affecting gold’s price.
China buys Gold
Media highlighted in the past few days China’s gold buying spree. According to media, the People’s Bank of China on Saturday said it bought 160,000 fine troy ounces in November, ending a six-month pause in purchases. The PBOC had been a major buyer of bullion since late-2022. The news took the markets by surprise as a possible renewal of China’s interest in gold buying could alter fundamentally the gold market, as another issue that has to be factored in any prognosis about gold’s price. should we see PBoC continuing to buy gold at this pace it could create bullish tendencies for gold’s price. It should be noted that PBoC is from now on expected to maintain an “appropriately loose” monetary policy and the Chinese government a more proactive fiscal policy. It’s understandable that an expansionary fiscal and monetary policy may require substantial financing which could have bearish implications for gold’s price. Furthermore we also note that China as launched an anti-trust probe into Nvidia with the FT stating that the investigation into Nvidia (#NVIDIA) was opened for suspected violations of the country’s anti-monopoly law. The investigation in our view, is a retaliatory measure by the Chinese Government as tensions between the USA and China over a potential trade war under the incoming Trump administration intensify. Overall should we see frictions in the relationships of the two super powers escalating, we may see also safe have inflows for the precious metal.
Geopolitics of the Middle East
In the Middle East we mark the end of an era, as the Assad regime in Syria, fell after substantial pressure from various rebel groups and Israel. Former President Assad has fled the country and is now in Russia which has given political asylum. The situation in Syria as such remains highly fluid, as no fraction seems to be having the upper hand clearly throughout the country. Kurdish forces, the Syrian National Army backed by Turkey , a mixture of antigovernment forces among which the HTS (formerly characterised as a terrorist group) seems to stand out, all are fighting for partial control of specific territories. At the same time, Israel’s Airforce is pounding positions in Syria, with more than 200 attacks being made. For the time being we see the case for instability in Syria to be enhanced, which in turn could support gold’s price by creating safe haven inflows for the shiny metal. On the flip side should we see the situation slowly stabilizing we may see such easing of market worries weighing on gold’s price.
Technical analysis
XAU/USD daily chart
-
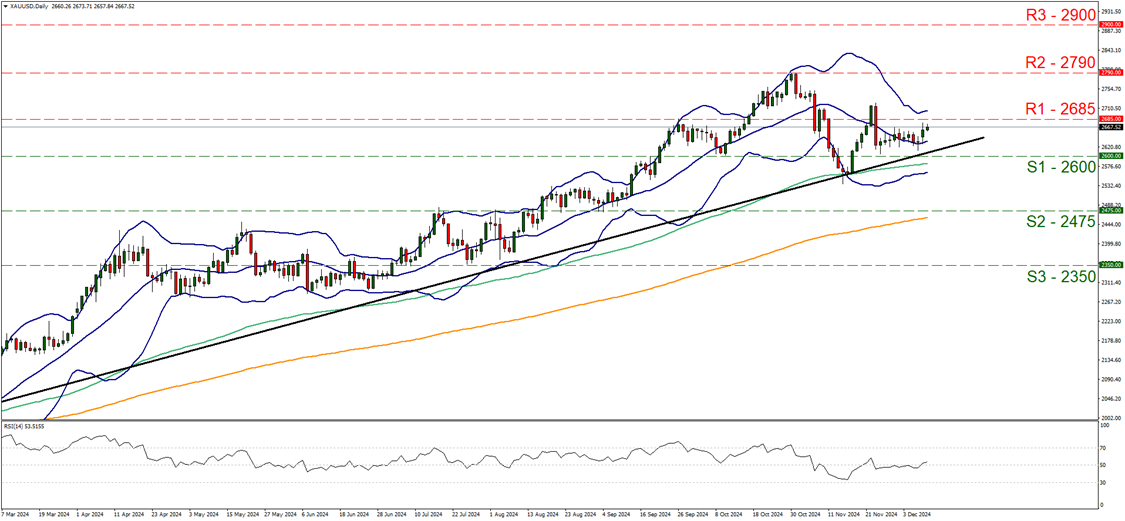
Support: 2600 (S1), 2475 (S2), 2350 (S3).
-
Resistance: 2685 (R1), 2790 (R2), 2900 (R3).
On a technical level, gold’s price edged higher yet it’s bullish tendencies seem to remain unconvincing for now, as the precious metal’s price continues to be moving in a sideways fashion, within the same boundaries since the 25th of November. We note that the price action of gold has been supported by an upward trendline incepted since the 14th of February yet the stabilisation of gold’s price over the past two weeks tells a different story. We maintain our bias for the sideways motion to continue for the time being and note that the RSI has risen above the reading of 50 yet remained close by, implying that the bearish sentiment among market participants for the precious metal has evaporated, yet at the same time, a bullish sentiment has not been build yet. Also please note that the Bollinger Bands have narrowed reflecting the lower volatility of the price action, which in turn may allow the sideways motion to continue. For the time being we maintain the 2685 (R1) resistance line and the 2600 (S1) support line as the upward and downward boundaries of the rangebound movement respectively. We note the slight upward movement yesterday and today yet, for a bullish outlook, we would require a clear break above the 2685 (R1) resistance line with the next possible target for the bulls being the 2790 (R2) resistance ceiling, which is also a record high level for the shiny metal. Even higher we note the 2900 (R3) as a possible target for gold bulls, should the bullion’s price enter unchartered waters. Lastly, for a bearish outlook, we would require a clear break below the 2600 (S1) support line and the precious metal’s price to start aiming actively for the 2475 (S2) support base. In an extremely bearish scenario, we may see the pair aiming for the 2350 (S3) support hurdle, which has not seen any price action since July.
Author

Peter Iosif, ACA, MBA
IronFX
Mr. Iosif joined IronFX in 2017 as part of the sales force. His high level of competence and expertise enabled him to climb up the company ladder quickly and move to the IronFX Strategy team as a Research Analyst. Mr.


