Gold Miners Could Shine In The Current Trading Environment

We're keeping a close eye on the ratio between gold miners ETF (GDX) against gold (XAU). We can see on the weekly chart that gold miners are trying to outperform the underlying metal, after hitting a major low in late 2016. Whilst the ratio corrected between the 2016 peak and 2018 low, bullish momentum is again turning higher. It's worth noting that the ratio began to rise in 2016 when investors were concerned of a global slowdown, and that we find ourselves in similar conditions today. If the ratio is to rise (so gold miners outperform gold) at a similar pace to 2016, the ratio could rise to its highest level since 2012.
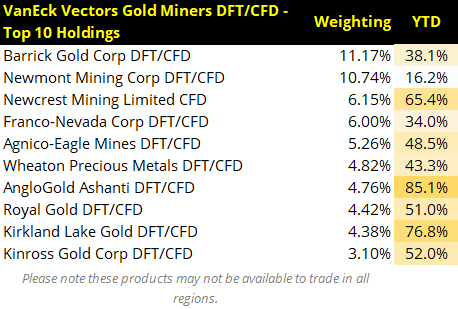
Traders who think the ratio is due to rise could consider a pairs-trade, and initiate a long GDX (VanEck Vectors Gold Miners DFT/CFD) and short gold. Alternatively, gold bugs could look to trade some of the equities within the index. Here we've listed the top 10 constituents by weight along with year to date performance.

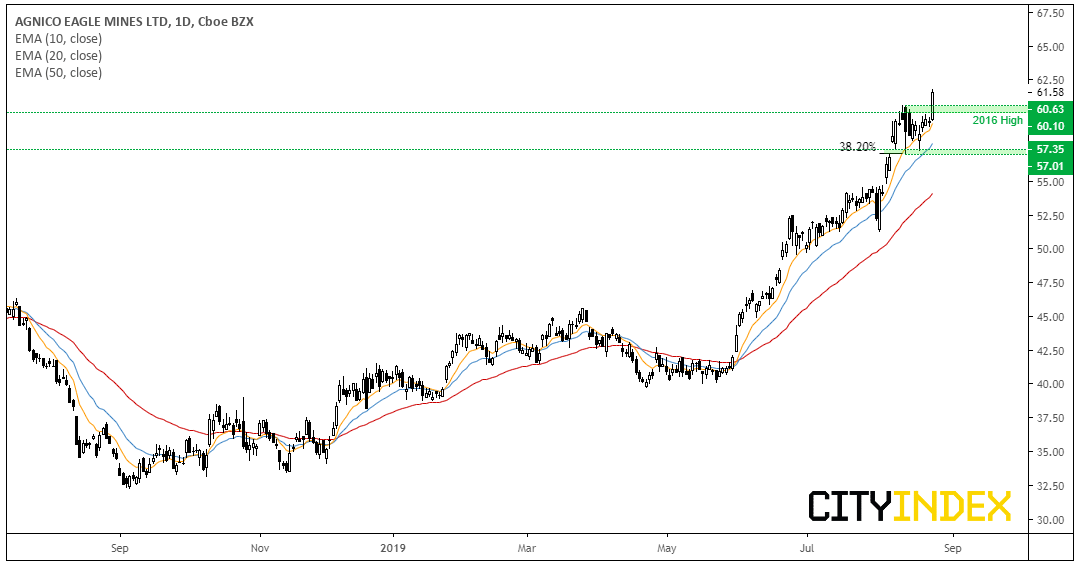
Agnico-Eagle Mines closed at a near 8-year high on Friday and has clearly broken out of compression. The 10-day eMA is currently acting as support, and the 10, 20 and 50-day eMA's all point high in ‘bullish order' to show momentum is gaining traction.
-
Near-term support sits around 60.10 to 60.63, so traders could seek to buy dips above this level.
-
However, the trend remains bullish above the 57 low, so we could also consider long opportunities above this support zone if we see a retracement first.
-
As we don't see major resistance until the 73 high, bulls could keep an open target.
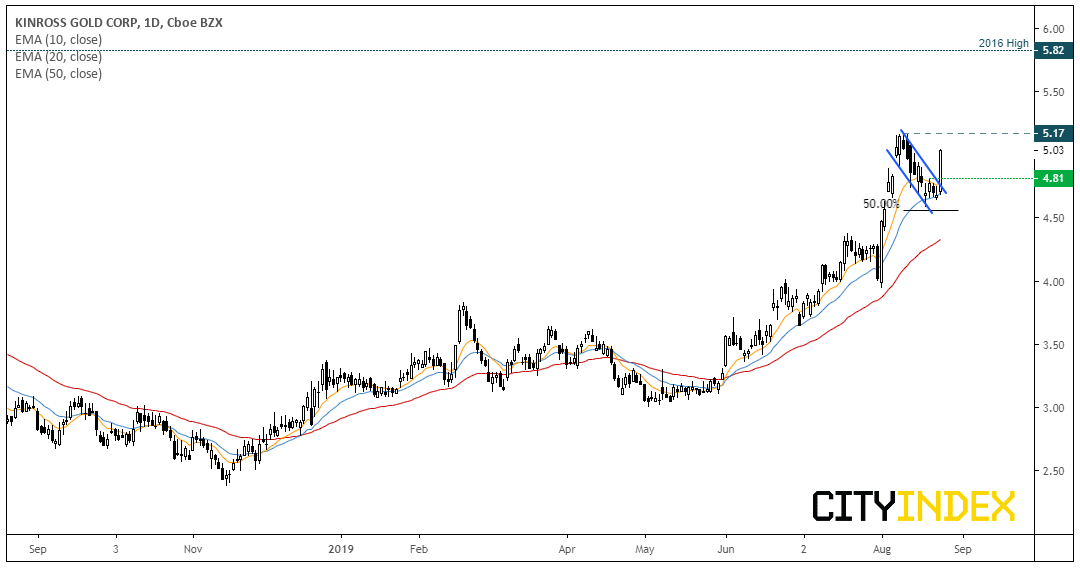
Kinross Gold Corp CFD has broken out of a corrective channel and appears poised to break above the 5.17 high. The correction stalled just shy of the 50% retracement level and found support around the 10 and 20-day eMA's. Price action is almost a mirror image of the GDX/XAU ratio so, if the ratio is to rise further, it could bode well for this stock.
-
Bulls could seek to buy dips above 4.81 and anticipate a break above 5.17, to target the 5.82 high.
-
A clear break below 4.58 places the idea onto the back burner, although technically the trend remains bullish above the 3.94 low.
Author

Matt Simpson, CFTe, MSTA
CityIndex
Matt Simpson is a certified technical analyst who combines charts and fundamentals to generate trading themes.


