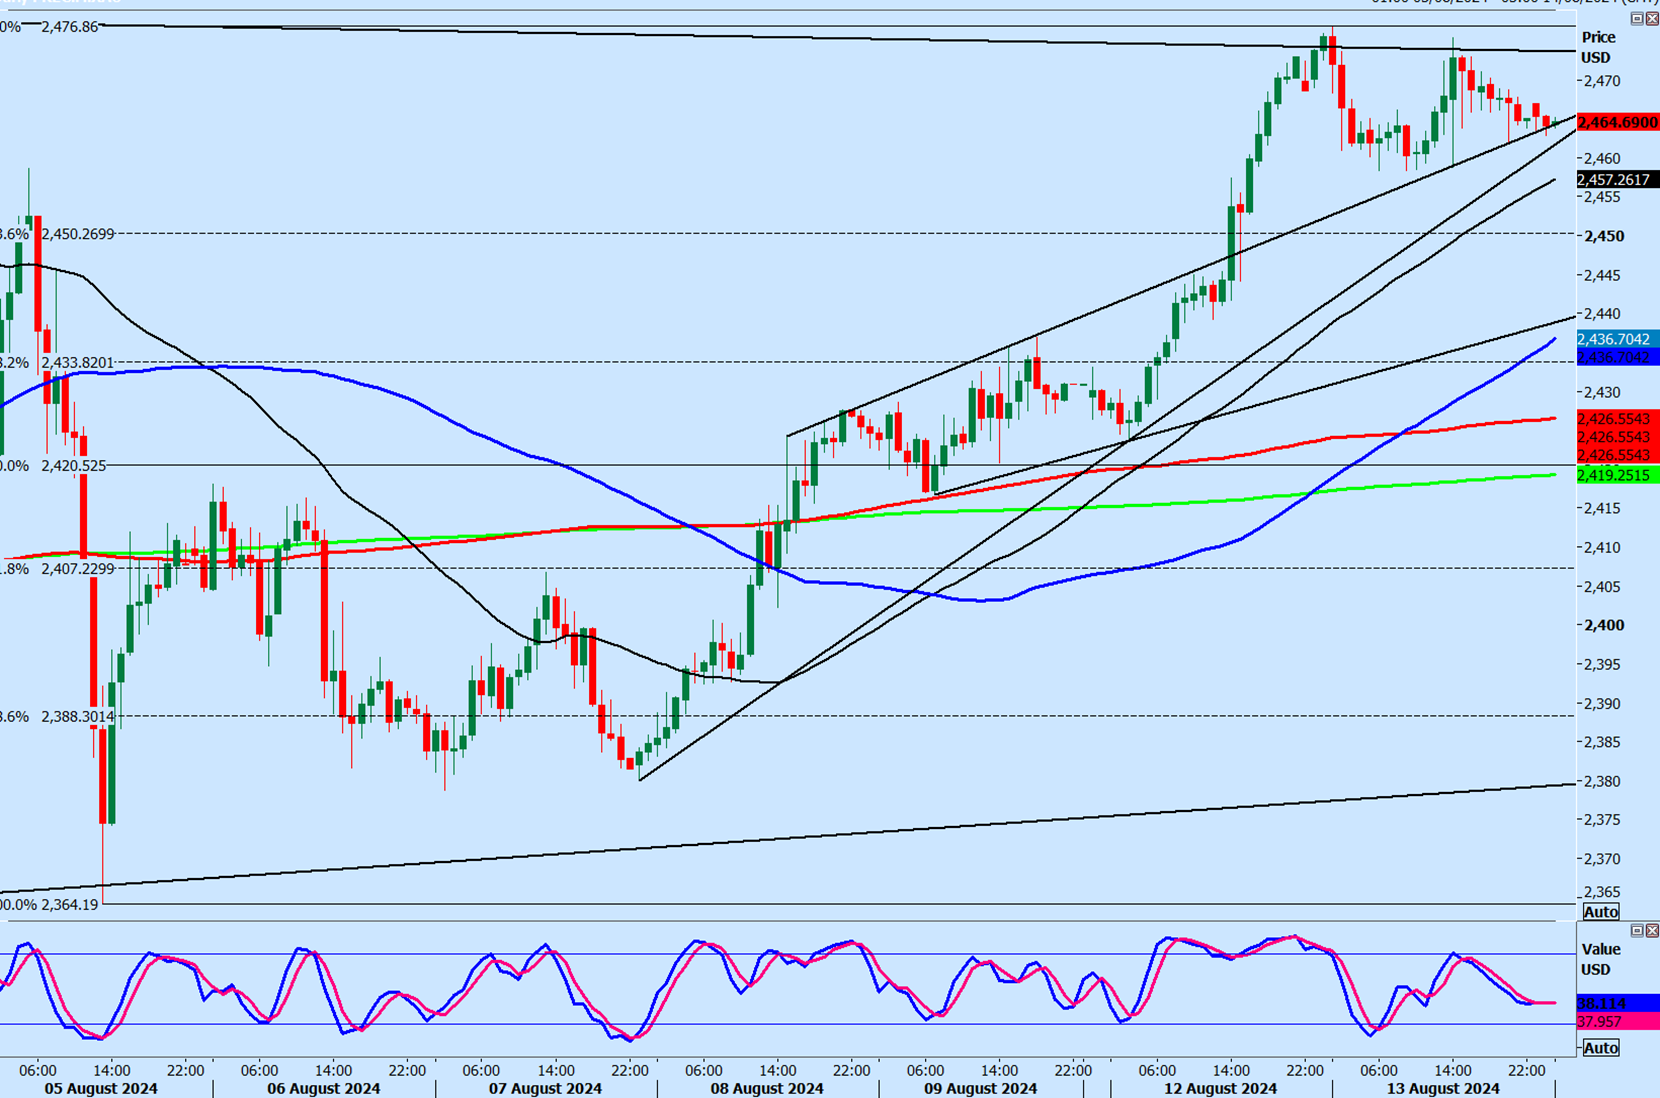
Gold holding the one month upper trend line which joins the July and August peaks at 2,473/75

Gold
-
Gold remains stuck in a 4 month sideways channel which makes trade identification difficult. With the release of the inflation number, anything could happen today.
-
We are holding the 1 month upper trend line which joins the July & August peaks at 2473/75, with a high for the day exactly here yesterday.
-
Gold is overbought so if we hold the trend line again today we will remain in a sideways channel, targeting 2463/62 & 2452/50, although yesterday we saw a low for the day in the middle of these 2 targets.
-
If you want to try a short I would stop above last week' peak at 2477/78. At least the trade has a good risk vs reward.
-
A break above 2479 tests the July all time high at 2483/84. Obviously bulls need a break above here to signal a potential new leg higher in the longer term 20 year bull trend. We may get that today on a weaker than expected inflation release.
-
A break below 2458 today can target 2452/50. If we continue lower we should find support at 2438/33. Longs need stops below 2430.
In a consolidation channel such as this, it is more likely that prices will break higher eventually, because it is expected to be a continuation pattern, not a reversal pattern. So the longer term bull trend is expected to continue higher eventually, although timing of the breakout above the all time high is impossible to know.
For example the dollar has been in a sideways trend for almost 2 years & has become almost impossible to identify low risk opportunities now. The moves are so random & erratic - no clear pattern to follow.
Prices just trade up & down, back & forth over old ground. Moving averages flat line & converge. Trend lines are no longer reliable.
Here's a note of the levels if you want to scalp the release of the inflation data: Resistance at 2473/75. Last week's high at 2477/78. July all time high at 2483/84. Below 2458 today can target 2452/50. Support at 2438/33.
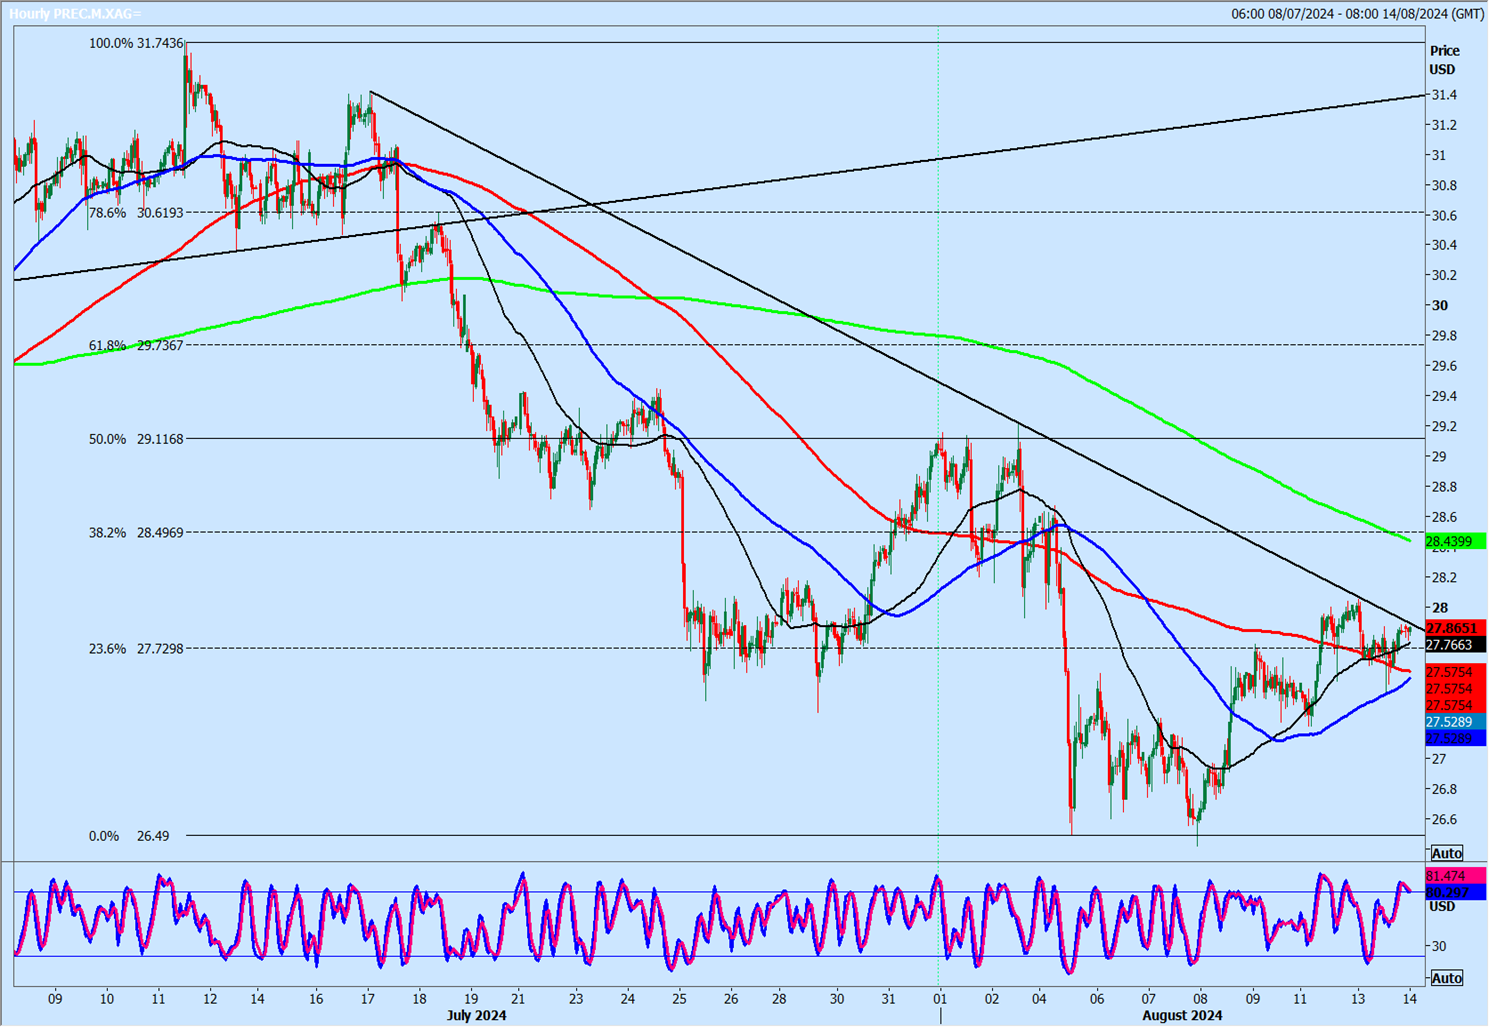
Silver
-
Silver has been trending lower to retest the July highs, Unable to hold above the peaks of 2021 & 2022; losing about 20% of it's value since May, so not much of a bull trend really.
-
Silver has bounced over the past week however & now tests a 4 week down trend line around the 23.6% Fibonacci at 2770/90. Shorts need stops above 2805. A break higher should be a buy signal targeting 2840/50. We are likely to pause here but shorts are probably too risky. If we continue higher look for 2900/2910 as the next target.
If you try a short at resistance at 2770/90, look for 2730/20 as the 1st target & perhaps as far as the August low at 2670/60.
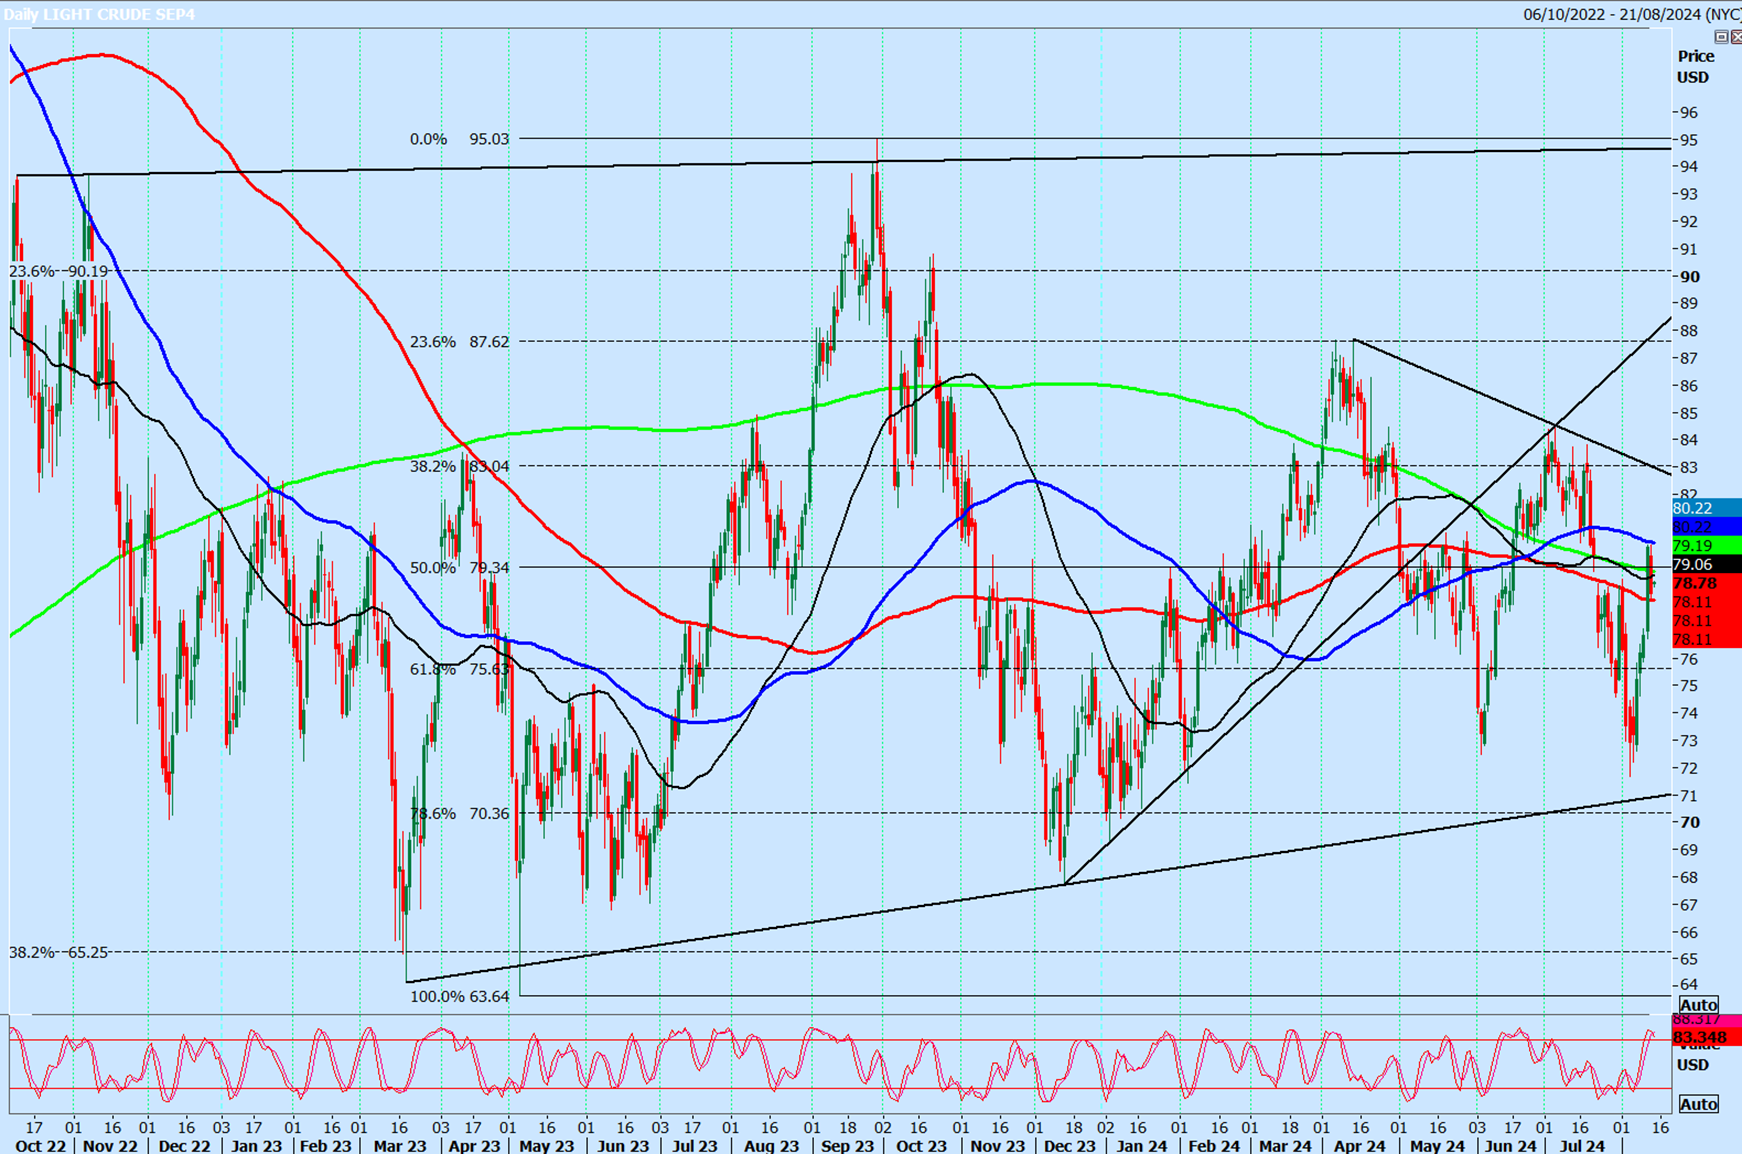
WTI Crude September future
Last session low & high for the September contract: 7816 - 8015.
(To compare the spread with the contract that you trade).
-
WTI Crude is yet another market caught in a longer term sideways channel, around 2 years old. We have retraced all the losses from mid July & we are exactly in the middle of that 2 year range.
-
It's particularly difficult to identify opportunities on the middle of the range of course, especially when moving averages have been flatlining & converging for 6 months.
-
My best guess is that if we hold above 7890/7850 (& we dipped to this area yesterday) we can continue higher towards 8300.
-
A break below 7800 (we held just above here yesterday) however risks a slide to 7660/20. For the last 11 months WTI Crude has been consolidating in a narrowing triangle pattern as the monthly ranges decrease. 11 month trend line resistance at 8250/8300 could be tested now.
Author

Jason Sen
DayTradeIdeas.co.uk


