Gold from descending triangle breakdown to ascending triangle rebound
- Gold prices broke lower from a descending triangle pattern, leading to a significant drop.
- The gold market is highly volatile, currently showing an ascending triangle pattern indicating potential upward momentum, with key resistance levels to watch.
- Despite last week's negative weekly candle, the medium-term outlook for gold remains bullish, and this correction is considered a strong buying opportunity at the lower support range.

Last week, gold prices formed a descending triangle pattern and eventually broke lower from the triangle's apex, leading to a strong drop. The significant support level lies within a narrow range, and the price action of this strong rebound will determine the next direction of prices. This correction is a strong buying opportunity for long-term investors based on the current price action.
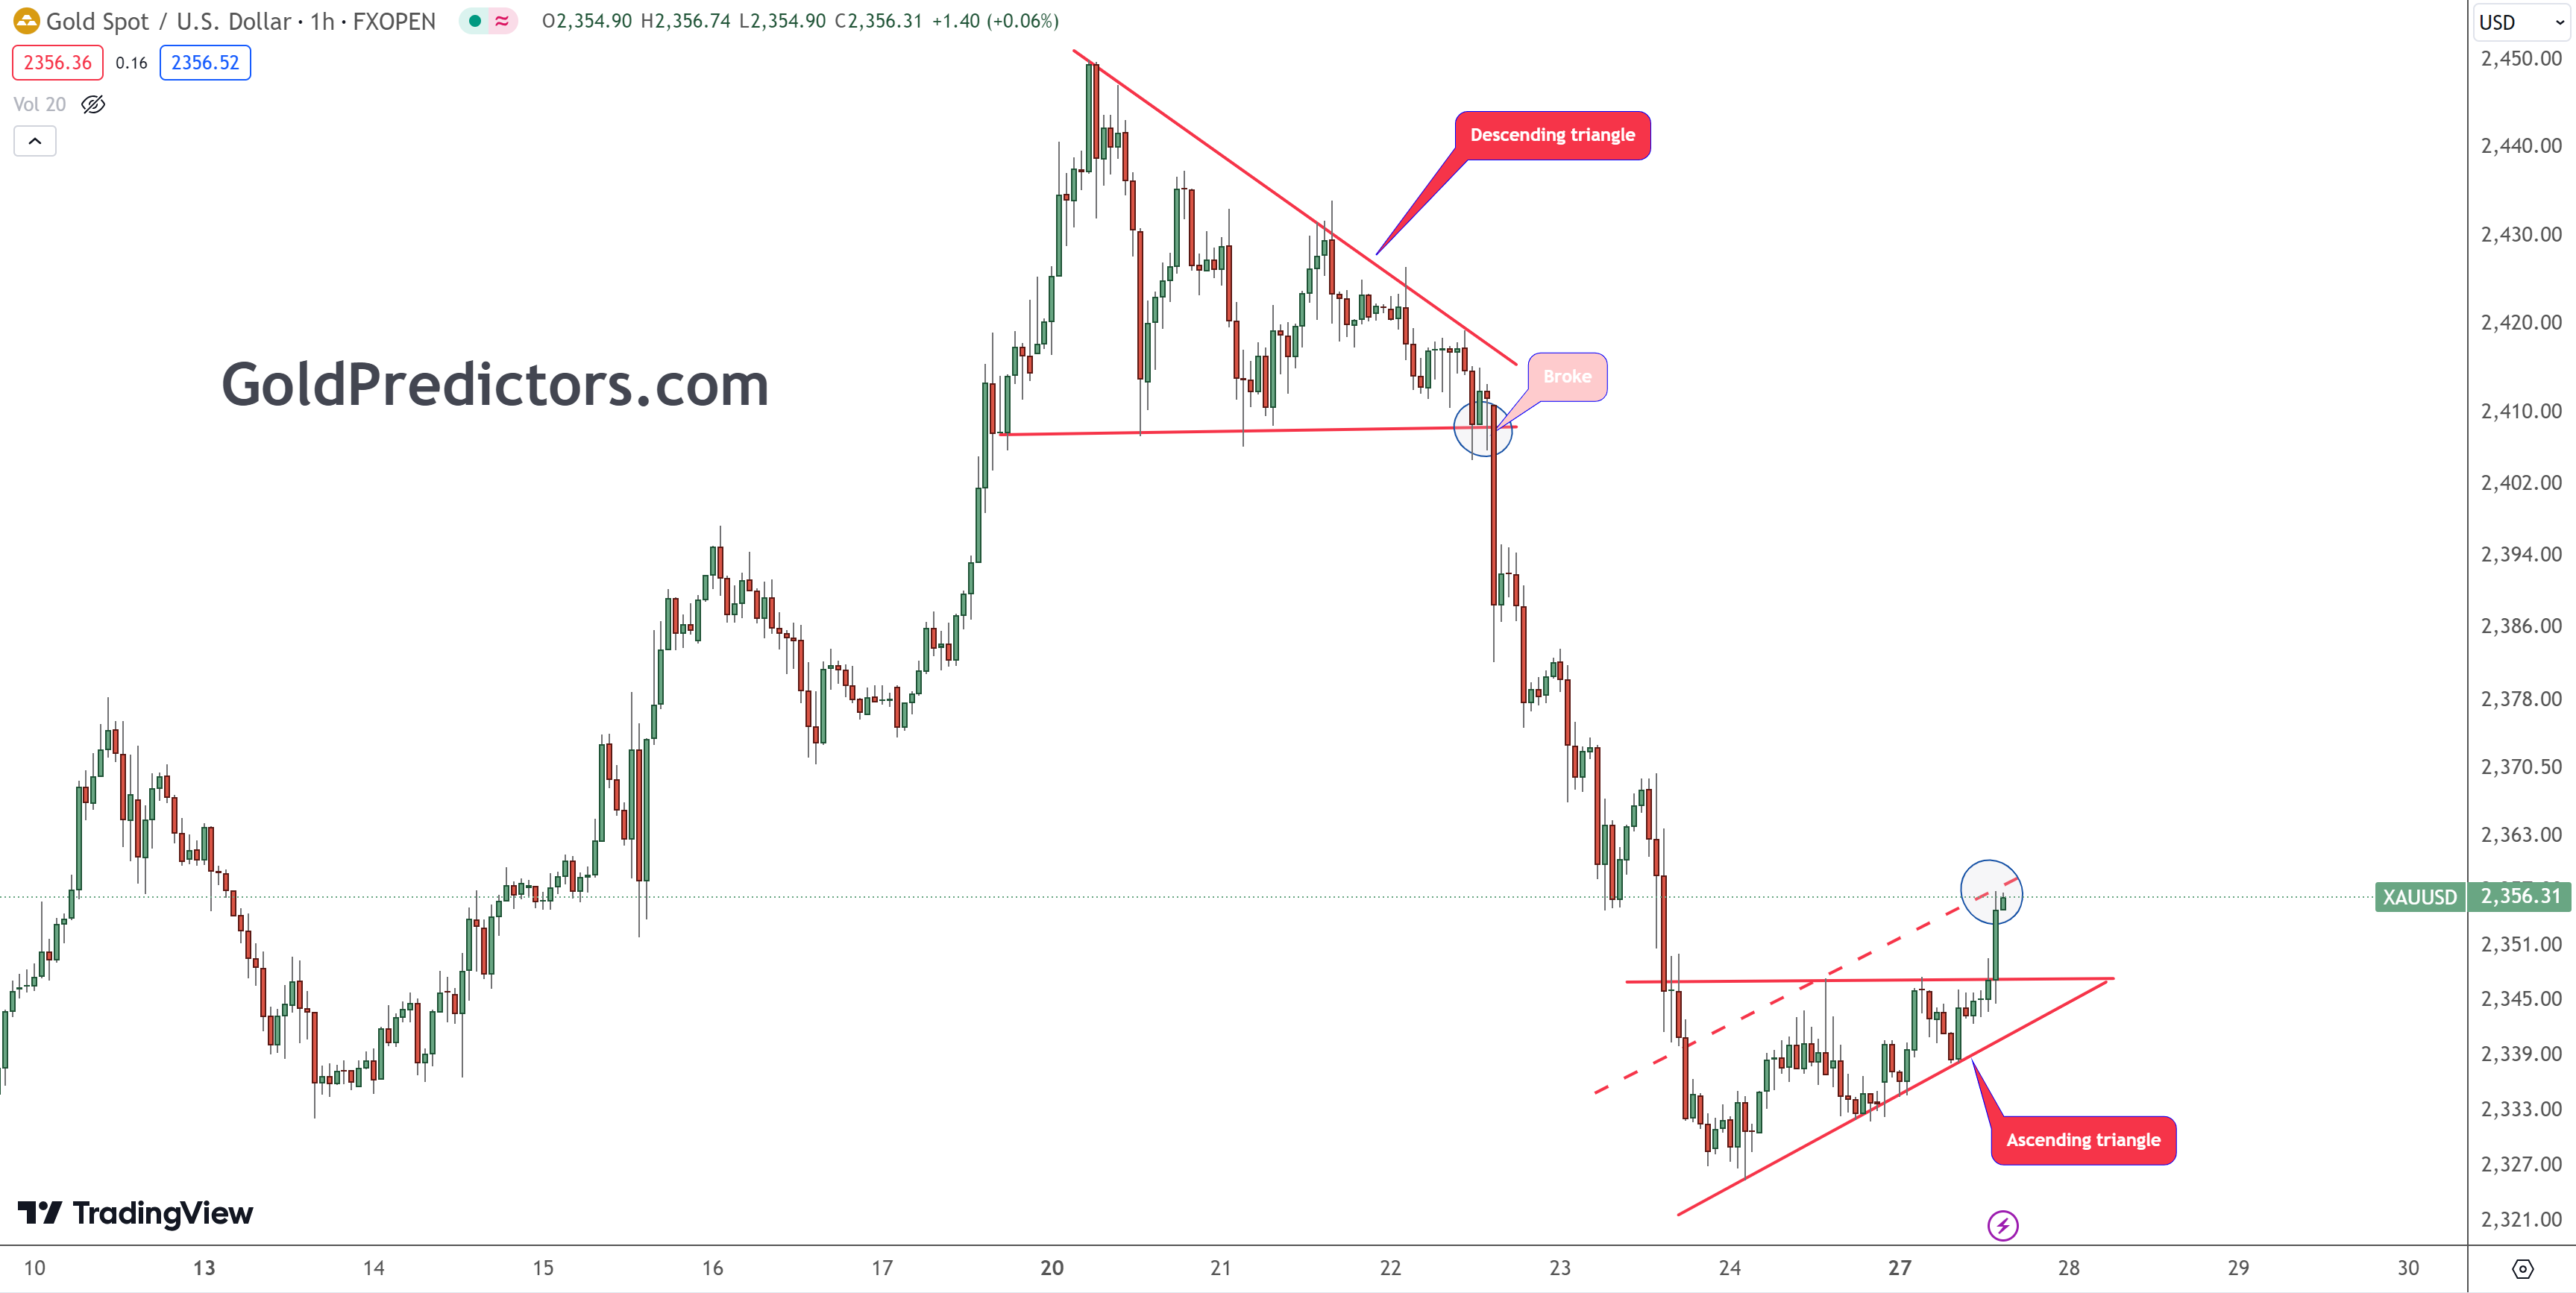
Gold prices react to descending and ascending triangle patterns
Last week, gold prices formed a descending triangle pattern and finally broke lower from the triangle's apex, as shown in the chart below. Following the breakout, gold prices traded lower, eventually creating a solid rebound from the bottom. The significant support level lies between $2,300 and $2,320, with the strong rebound from these levels encountering its first resistance at $2,355, as indicated by the channel lines.
Traditionally, these channels suggest forming a bear flag pattern, which is bearish only when the price breaks below the lows of the channel. The resistance of the bear flag pattern lies around $2,356. However, the current market conditions for gold are highly volatile. Interestingly, after forming a bottom at the lows, the gold market is now forming an ascending triangle, indicating a potential continuation of the upward momentum. This ascending broadening was broken, and prices traded at the bear flag resistance line. A break above this resistance will invalidate the bear flag pattern.
The initial resistance for this rebound is between $2,355 and $2,375. Due to the increased volatility following last week's drop, gold may consolidate within a broader range. A daily close above $2,375 would signal a continuation of bullish momentum. However, last week's weekly candle was negative, adding an element of uncertainty to the gold market.
Bottom line
Overall, the gold market is experiencing significant volatility, with recent patterns suggesting a potential for continued upward movement. The key levels to watch are the support at $2,300-$2,320 and resistance at $2,355-$2,375. A daily close above $2,375 would confirm a bullish trend despite the uncertain market conditions highlighted by last week's negative weekly candle.
However, the medium-term prospects for the gold market remain strongly bullish as the price has broken through the long-term pivotal area of $2,075. This correction is a healthy sign for investors and suggests further upside momentum. On the other hand, seasonal factors also indicate potential corrections or consolidations before the next surge. The traditional long-term support levels on a long-term basis are between $2,100 and $2,280.
Unlock exclusive gold and silver trading signals and updates that most investors don’t see. Join our free newsletter now!
Unlock exclusive gold and silver trading signals and updates that most investors don’t see. Join our free newsletter now!
Author

Muhammad Umair, PhD
Gold Predictors
Muhammad Umair is a financial markets analyst and investor who focuses on the forex and precious metals markets.


