Gold Forecast: Scope for rally to $1375 as Stoxx 50 looks southwards

Gold is well bid this Friday morning in Europe on the back of risk aversion and USD weakness. The yellow metal is up for the third consecutive season and currently trades around $1293 levels. Prices clocked a new 10-week high of $1295 levels. The metal looks set to break above $1300 levels as the risk aversion in the Stoxx 50 index is set to worsen in the short-term.
Gold Technicals
Weekly Chart - Bullish continuation pattern
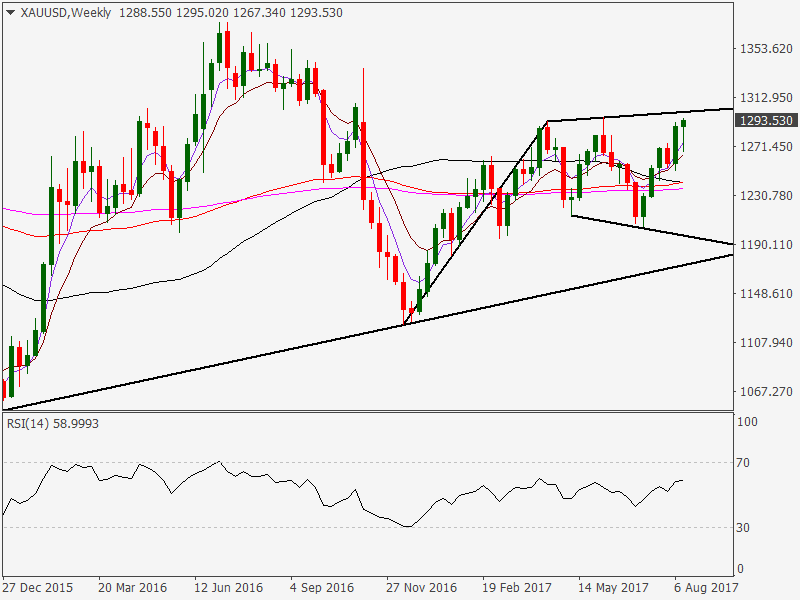
- Higher lows and a bullish RSI coupled with the risk aversion in the markets is likely to yield a bullish break above $1300 levels [Flag resistance + psychological hurdle].
- A weekly close above $1300 would signal continuation of the rally from the Dec 2015 low of $1046.33 and shall open doors for a re-test of $1375 [2016 high] - $1400 levels.
Daily chart - Rising channel established
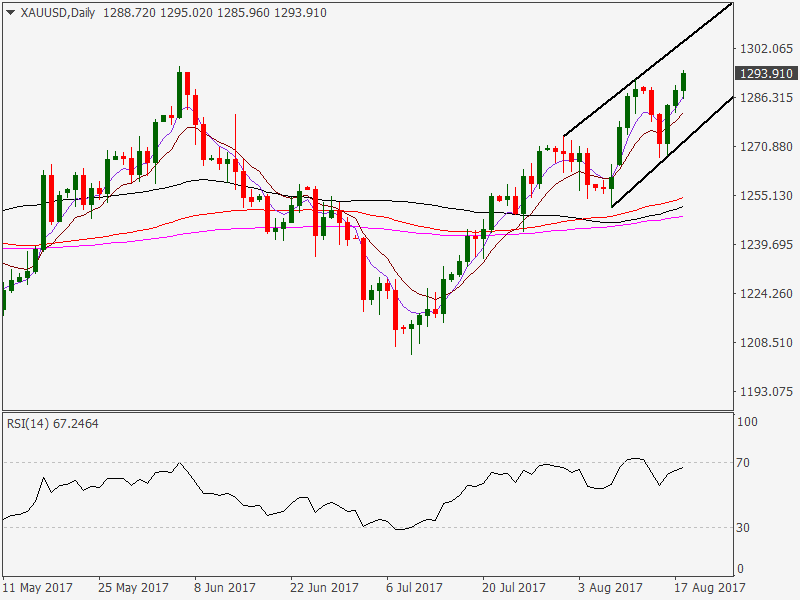
- The rising channel resistance is seen around $1303 levels.
- The 14-day RSI is close to being overbought
Stoxx 50 Technicals
Daily chart - Topping pattern
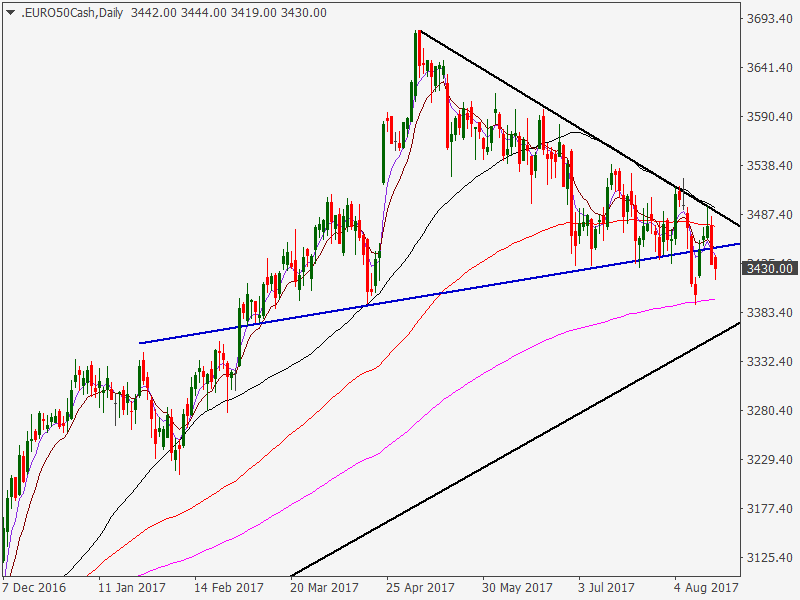
The chart above shows-
- Falling top formation
- Head and Shoulders breakdown
- 50-DMA and 100-DMA have topped out
Weak bears have been crowded out over the last two weeks as the index peeped above the head and shoulders neckline before falling back to 3400 levels today. The index looks set to test 3356 levels [sop offered by the trend line sloping upwards from June 2016 low and Nov 2016 low] and possibly break lower towards 3241 [Feb low].
To conclude:
The risk-off in the stocks looks set to worsen, thus the yellow metal could revisit 2016 highs around $1375 levels.
Author

Omkar Godbole
FXStreet Contributor
Omkar Godbole, editor and analyst, joined FXStreet after four years as a research analyst at several Indian brokerage companies.


