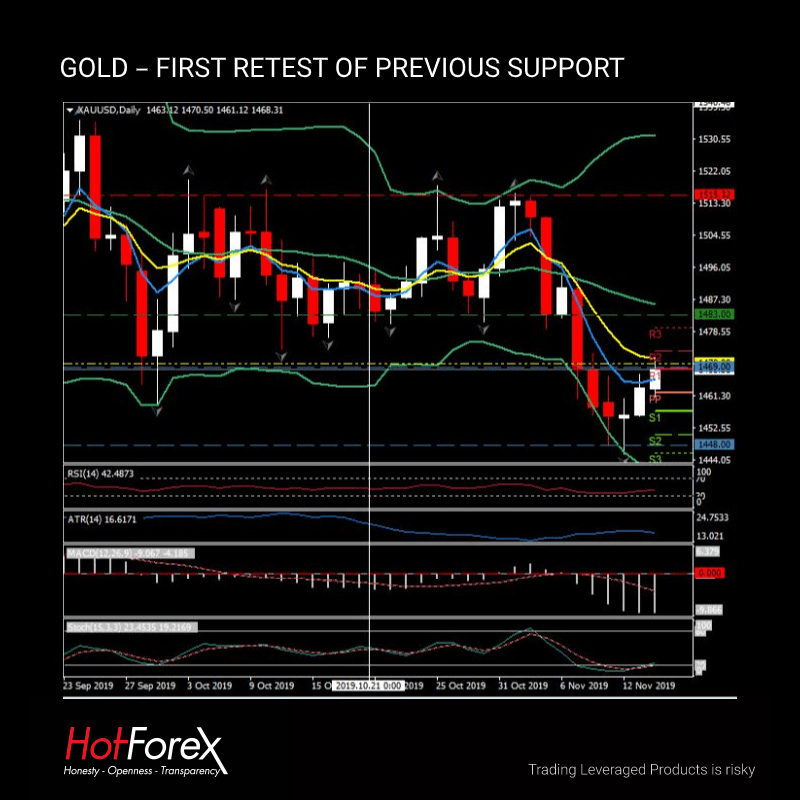
GOLD – First retest of previous support

GOLD, Daily, H4 & H1
Last Tuesday (November 5) Gold closed down some $26.00, with a large bearish candle and below the key 20-day moving average. It had also closed below $1486 which had been a key Fibonacci extension level in the summer rally to $1555. The price paused Wednesday before another significant sell-off ($22.00) on Thursday (November 7). The close on Thursday took the price below the next key support level at $1470.00. Further falls on Friday and Monday occurred as the $1450 level was tested but the price failed to close lower again. Today, the price is re-tracing and once again testing back to the $1470.00 level.
The Crossing EMA Strategy (Daily) would have been triggered on November 5 with the price moving down to Target 1 (1 x ATR $1469) November 7 and Target 2 (2.5 x ATR – $1488) November 12 for a net gain of $35.00 or 3500 pips.
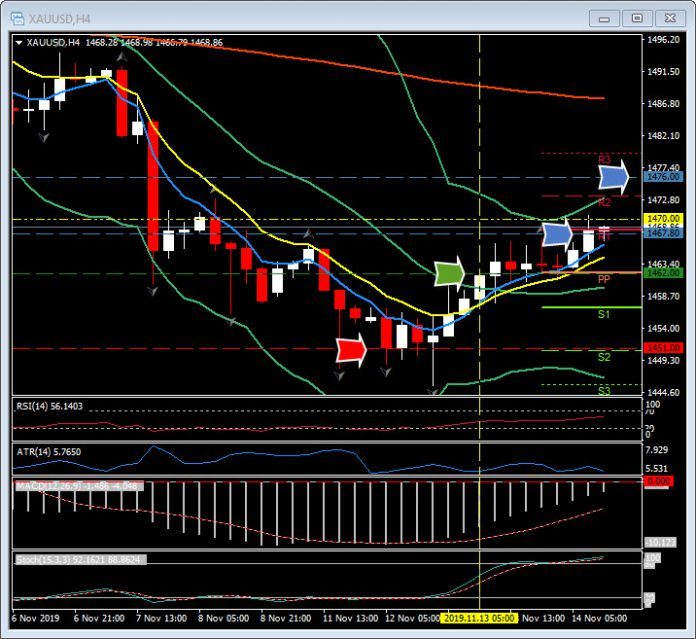
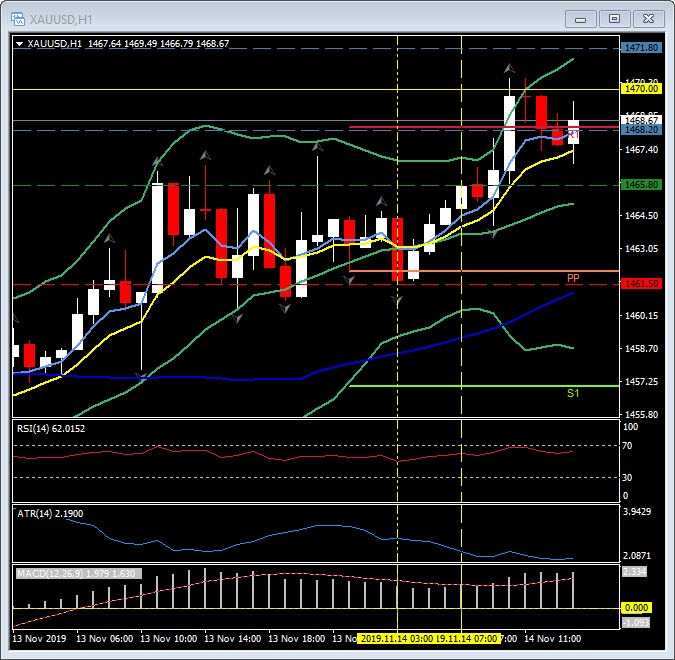
The H4 time-frame trigger LONG yesterday at $1462 producing T1 at $1467.80, T2 at $1476.00 and an initial Stop Loss, below the turn in the market at $1451.00. The H1 time- frame, from a failed move lower this morning during the Asian session, has turned higher This triggered a long entry at $1465.80, with T1 at $1468.20, T2 at 1471 .80 and an initial Stop loss at $1461.50.
The higher time frames (Weekly and Monthly) remain biased to the upside (despite last week’s very significant sell-off) and a breach and break on the Daily time frame back over the $1470-86 zone would be required to moves prices back towards $1500, $1515, $1535 and that summer high at $1550. Weekly support sits at $1440 and $1400.
Author

With over 25 years experience working for a host of globally recognized organisations in the City of London, Stuart Cowell is a passionate advocate of keeping things simple, doing what is probable and understanding how the news, c


