Gold falls to an eight-month low: This may not be the bottom

Gold stabilised near 4,000 USD per troy ounce on Thursday but remained close to its lowest levels in almost eight months. The market continues to face pressure from a stronger US dollar and growing expectations of further monetary policy tightening by the Federal Reserve.
The US Dollar Index refreshed its highest level in more than a year, making gold more expensive for buyers using other currencies. This traditionally reduces demand for the precious metal.
Last week, the Federal Reserve left interest rates unchanged but signalled that it remained ready to tighten policy further. Fed Chair Kevin Warsh once again reaffirmed the regulator’s commitment to fighting inflation. The market is now pricing in a high probability of a rate hike as early as September, with the possibility of further moves before the end of the year.
Expectations of higher interest rates are currently outweighing the support that gold could have received from lower geopolitical tensions.
Progress in negotiations between the US and Iran helped oil prices return to the levels seen before the conflict and significantly reduced inflation risks. As a result, demand for safe-haven assets was left without strong support.
Technical analysis
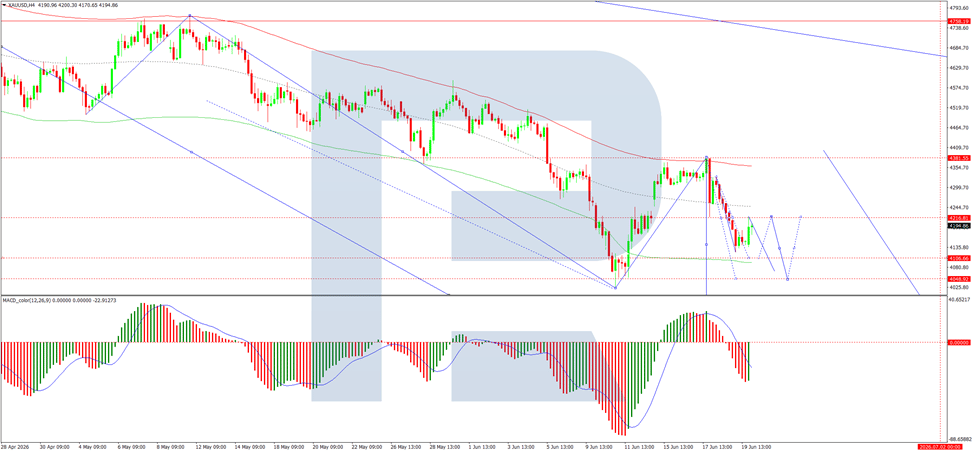
On the H4 chart of XAU/USD, the market formed a consolidation range around 4,099 and completed a downward wave to 3,960. We expect a corrective move towards 4,099, testing this level from below. After that, the probability of a new decline towards 3,869 may be considered, with the potential for the wave to extend to 3,828.
The MACD indicator confirms the current downward impulse. The signal line is below the central line and is pointing firmly downwards.
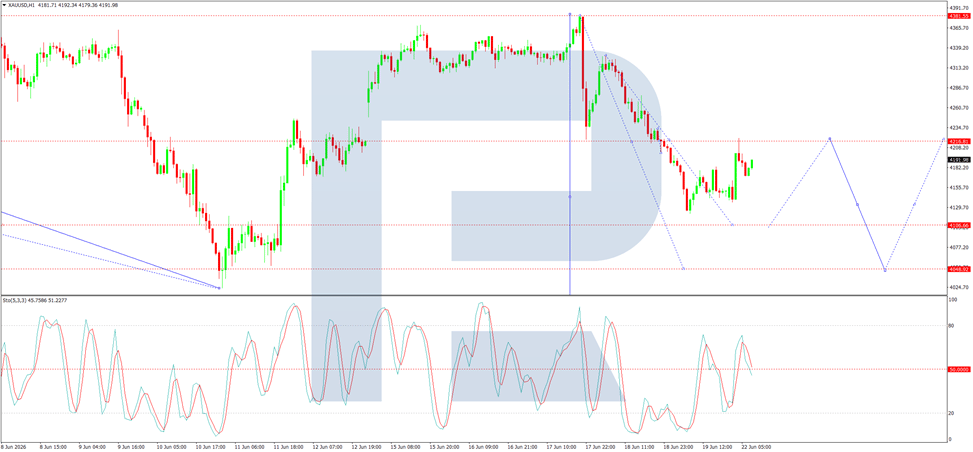
On the H1 chart, the market broke below 4,099 and completed a downward wave towards 3,960. Going forward, the possibility of a correction towards 4,099 may be considered, with this level tested from below.
In practice, a trend-continuation pattern is forming to the downside. After that, a decline towards 3,860 is expected, with the potential for the trend to continue towards 3,828.
The Stochastic oscillator confirms this scenario: the signal line remains below 50 and is under pressure to decline towards 20.
Author

RoboForex Analysis Department
RoboForex
RoboForex Analysis Department provides timely market insights, expert technical analysis, and actionable forecasts across forex, commodities, indices, and equities.