Crypto Market Overview: Bitcoin tests $60,000 as whales sell off – Aave and Jupiter show resilience
- Bitcoin defends the key $60,000 psychological support level on Thursday amid whale dumping.
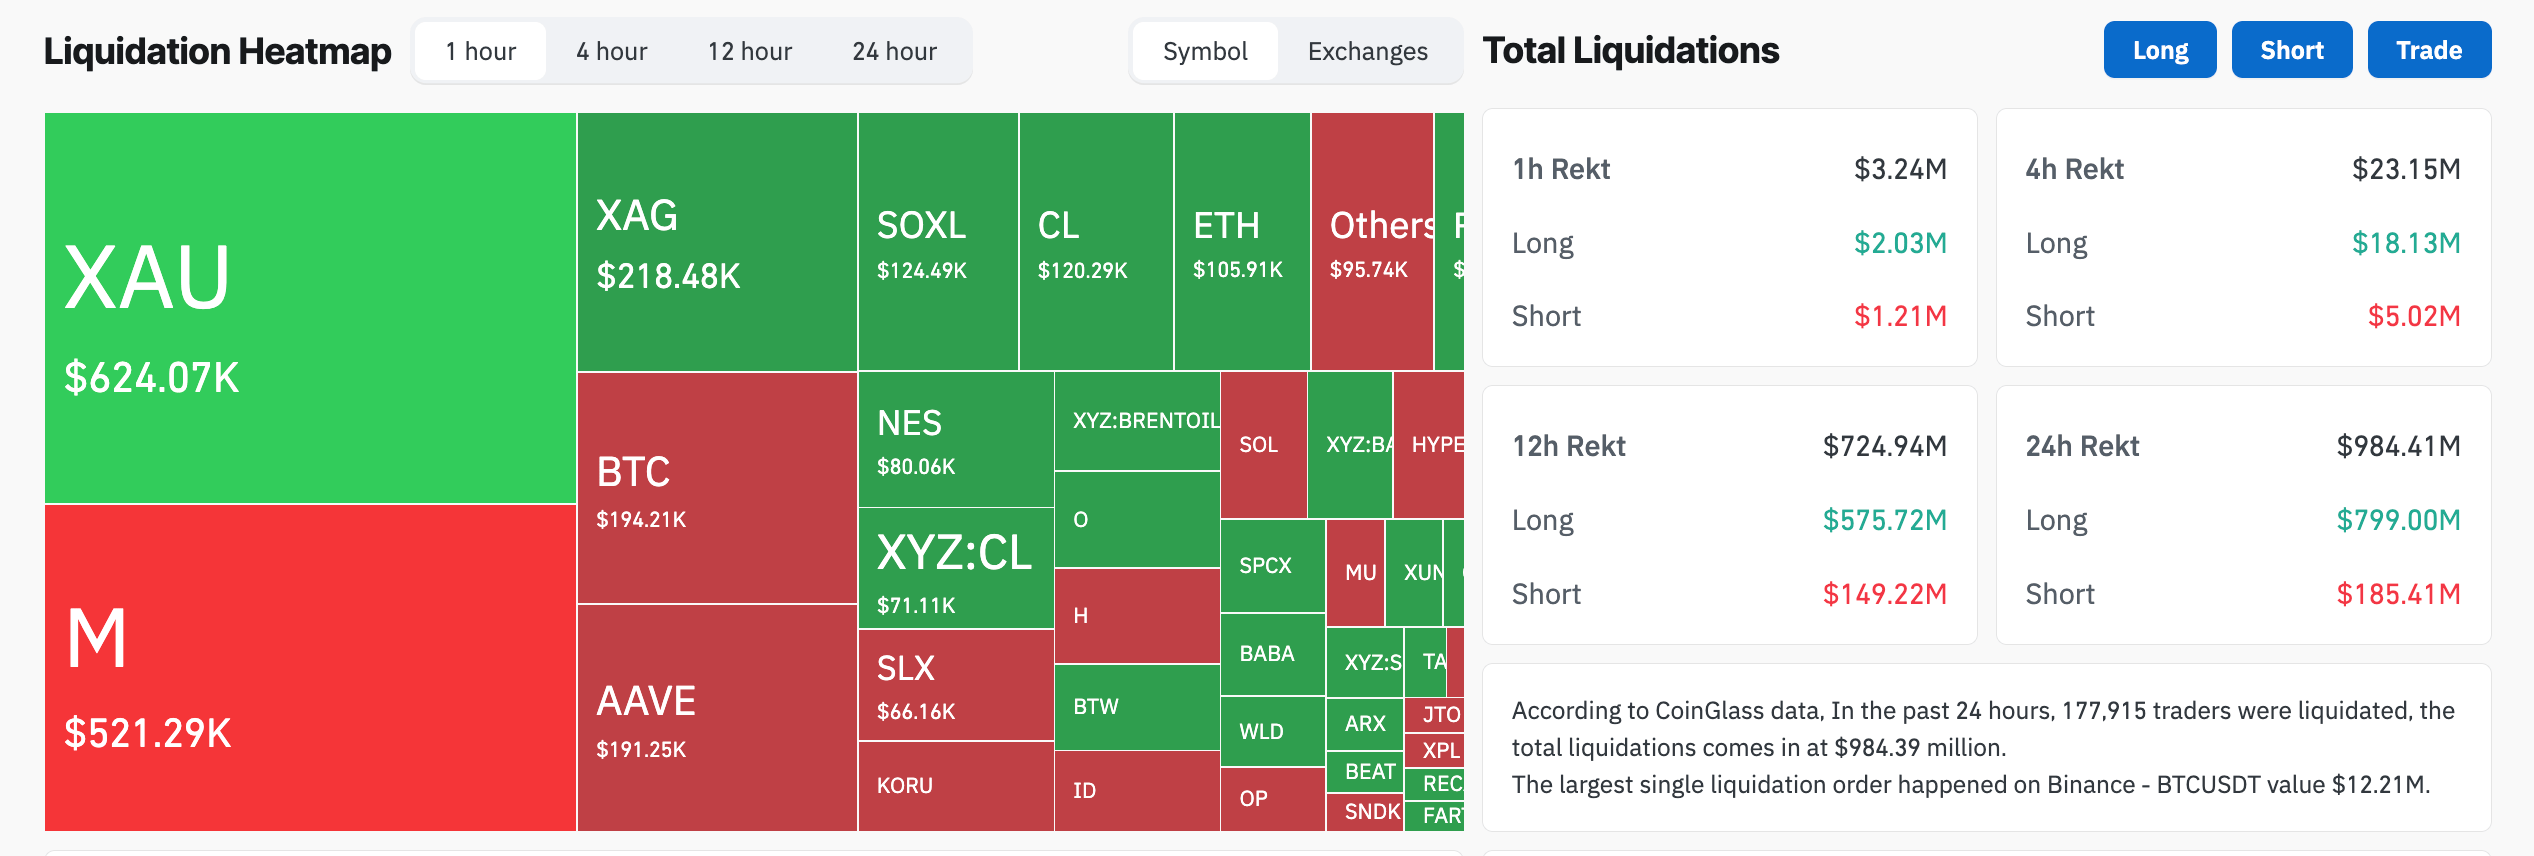
- Total liquidations approach $1 billion over the last 24 hours, while the crypto market sheds over 50% of its value.
- Aave and Jupiter remain resilient amid the broader market sell-off, emerging as the top gainers over the past 24 hours.

The broader cryptocurrency market remains under intense selling pressure, with Bitcoin (BTC) back at $60,000 for the third time this year. On-chain data shows selling pressure from large-wallet investors, commonly referred to as whales, while total liquidations hit nearly $1 billion in 24 hours. Although sellers remain dominant, DeFi tokens such as Aave (AAVE) and Jupiter (JUP) show resilience and emerge as top performers in the same time period.
Crushing pressure on the crypto market
The total crypto market cap has fallen by 54% from its October 2025 peak, erasing roughly $2.2 trillion in value over that period, as previously reported by FXStreet. Amid the declining period, total liquidations of $984 million over the last 24 hours, driven by $799 million in long liquidations, indicate firm sell-side dominance among investors.
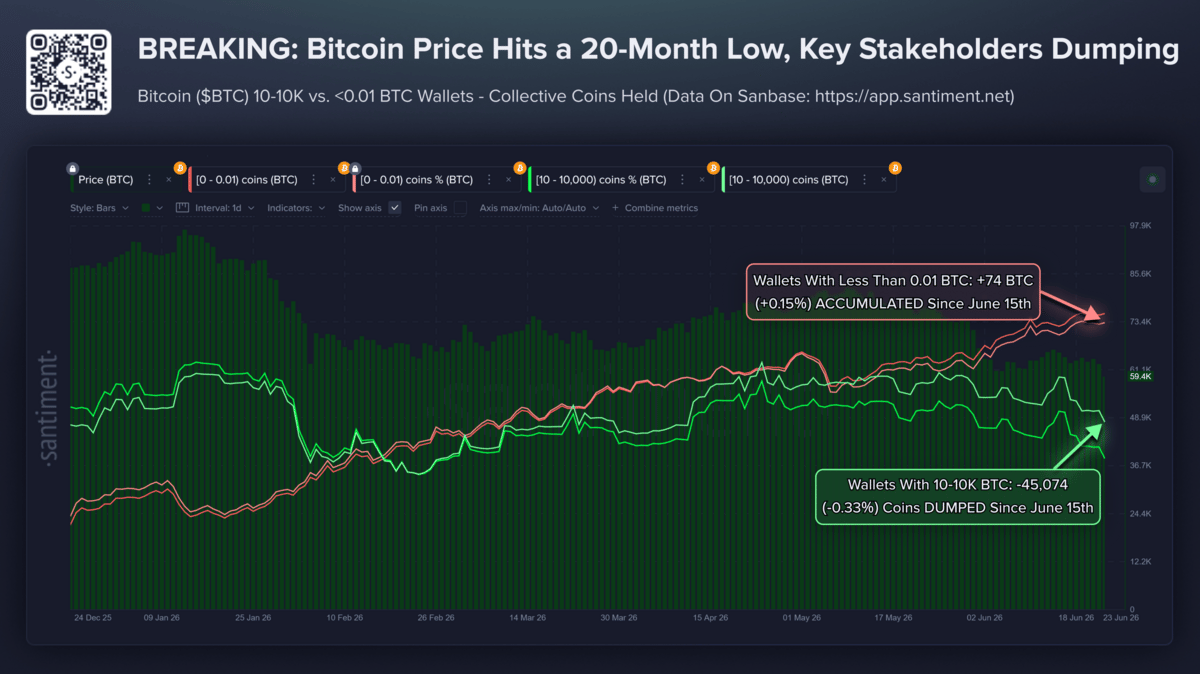
Adding to the selling pressure, Santiment data shows the whales holding 10 to 10,000 BTC have offloaded 45,074 BTC over the past 8 days. Typically, outflows from such large wallets weigh on crypto, leading to an extended decline.
Bitcoin defends a key psychological support
Bitcoin hovers above $60,000 at press time on Thursday, holding just above the key horizontal floor. The King Crypto maintains a bearish near-term bias while remaining capped well below the 50-day Exponential Moving Average (EMA) at $68,229 and the 200-day EMA at $78,198.
That said, the Moving Average Convergence Divergence (MACD) risks crossing below its signal line, hinting at a renewal of bearish momentum. At the same time, the Relative Strength Index (RSI) near 33 still reflects weak demand after the recent slide.
On the downside, immediate support is located at the $60,000 area, where a clear break would expose deeper losses and signal a continuation of the broader correction.
On the topside, initial resistance appears at the 50-day EMA around $68,229, followed by the former rising trendline break near $73,636 and then the 200-day EMA at $78,198; only a sustained recovery above this layered resistance zone would ease the current downside pressure.
DeFi tokens emerge as resilient crypto
AAVE hovers above its 50-day EMA at $79.45 at press time on Thursday, following its 10% rise the previous day. From a technical perspective, the DeFi token extends a positive rebound in a falling channel pattern, maintaining its near‑term constructive bias. That said, the overhead resistance trendline near the $100 mark, followed by the 200-day EMA at $118, caps the short-term recovery phase. This configuration suggests price is building a short-term base above dynamic support but remains embedded in a broader corrective phase.
Momentum supports the recovery tone, with the RSI near 61 and MACD holding above its signal line, both hinting that buyers retain the upper hand as long as the 50-day EMA holds.
On the topside, initial resistance aligns with the long-standing downward trendline near $100, and above that, the 200-day EMA at $118 acts as a more strategic barrier, limiting any medium-term bullish extension.
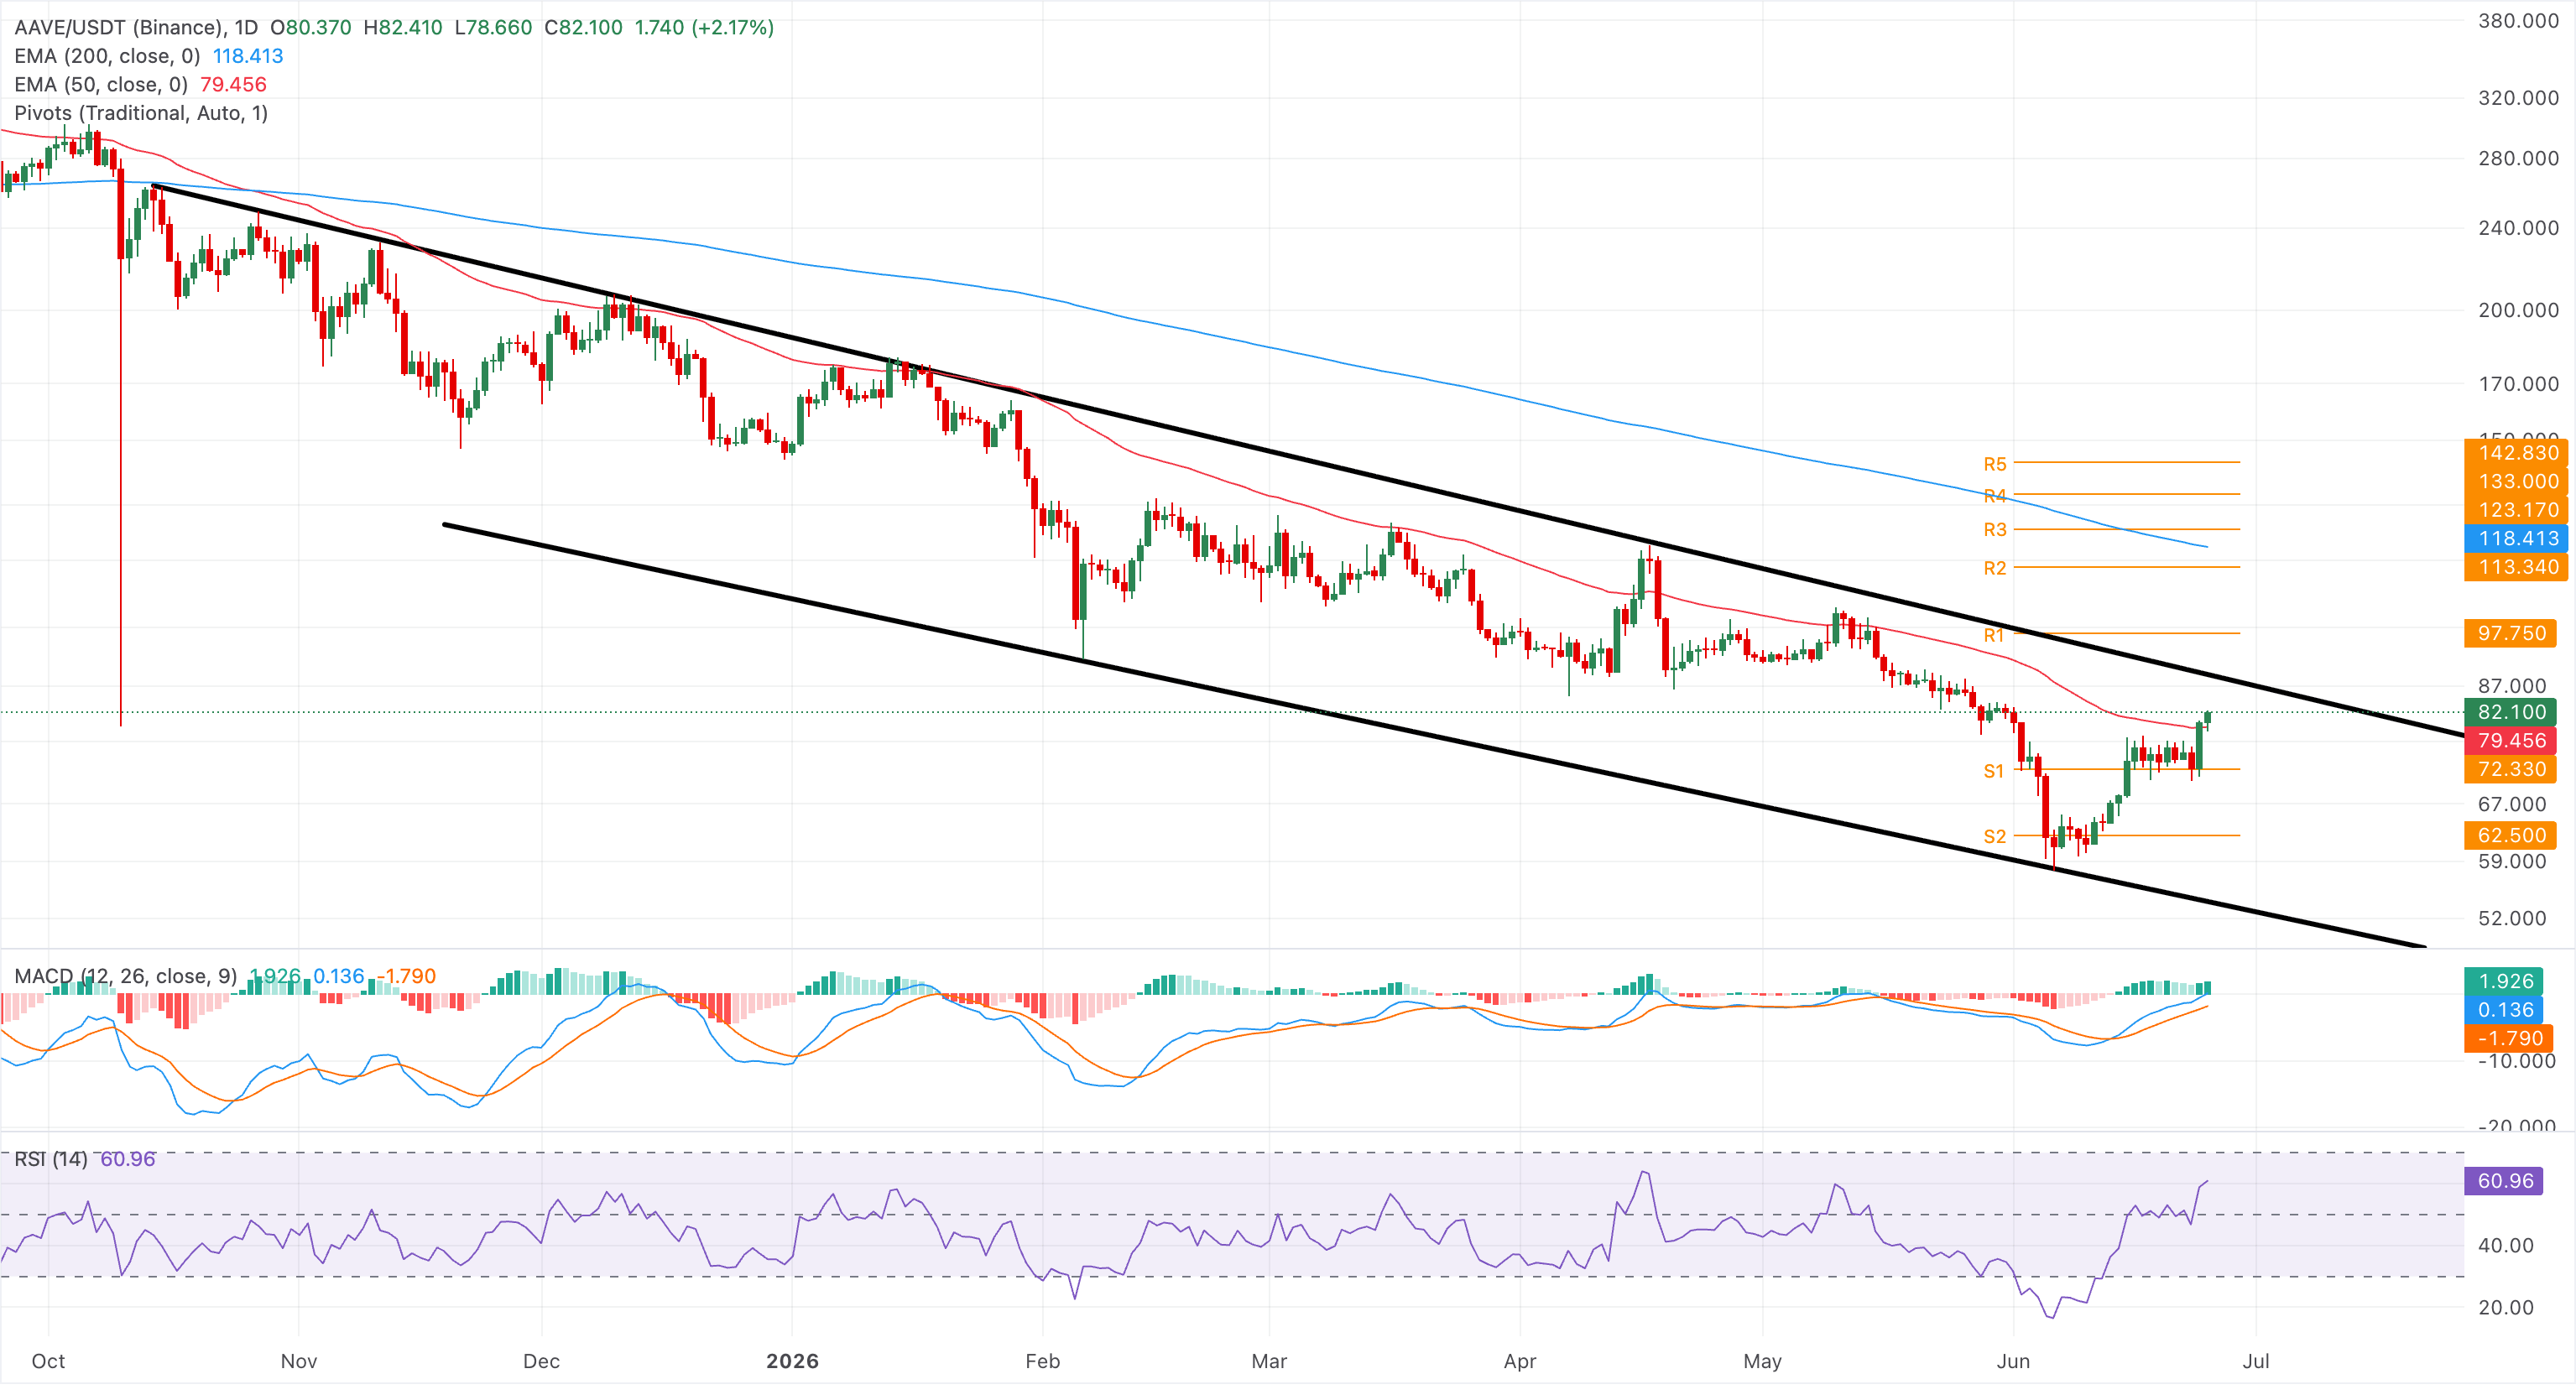
On the downside, the 50-day EMA at $79.45 is the first meaningful support; a daily close back below this level would undermine the nascent bullish structure and expose the pair to a deeper pullback, while holding above it would keep the recovery path open toward the $100 area.
Jupiter hovers above its 200-day EMA at $0.2198, with the 50-day EMA at $0.1910 underpinning support. The DeFi token maintains a neutral-to-slightly constructive bias as price tests the longer-term average. A rising RSI near 63, a positive MACD line above zero, and a constructive histogram suggest buyers retain the initiative while this squeeze between key EMAs persists.
On the topside, immediate resistance is at the 200-day EMA around $0.2198, with a subsequent hurdle near the downtrend resistance line projected from prior highs at around $0.2498, where a decisive break would signal a more convincing bullish reversal.
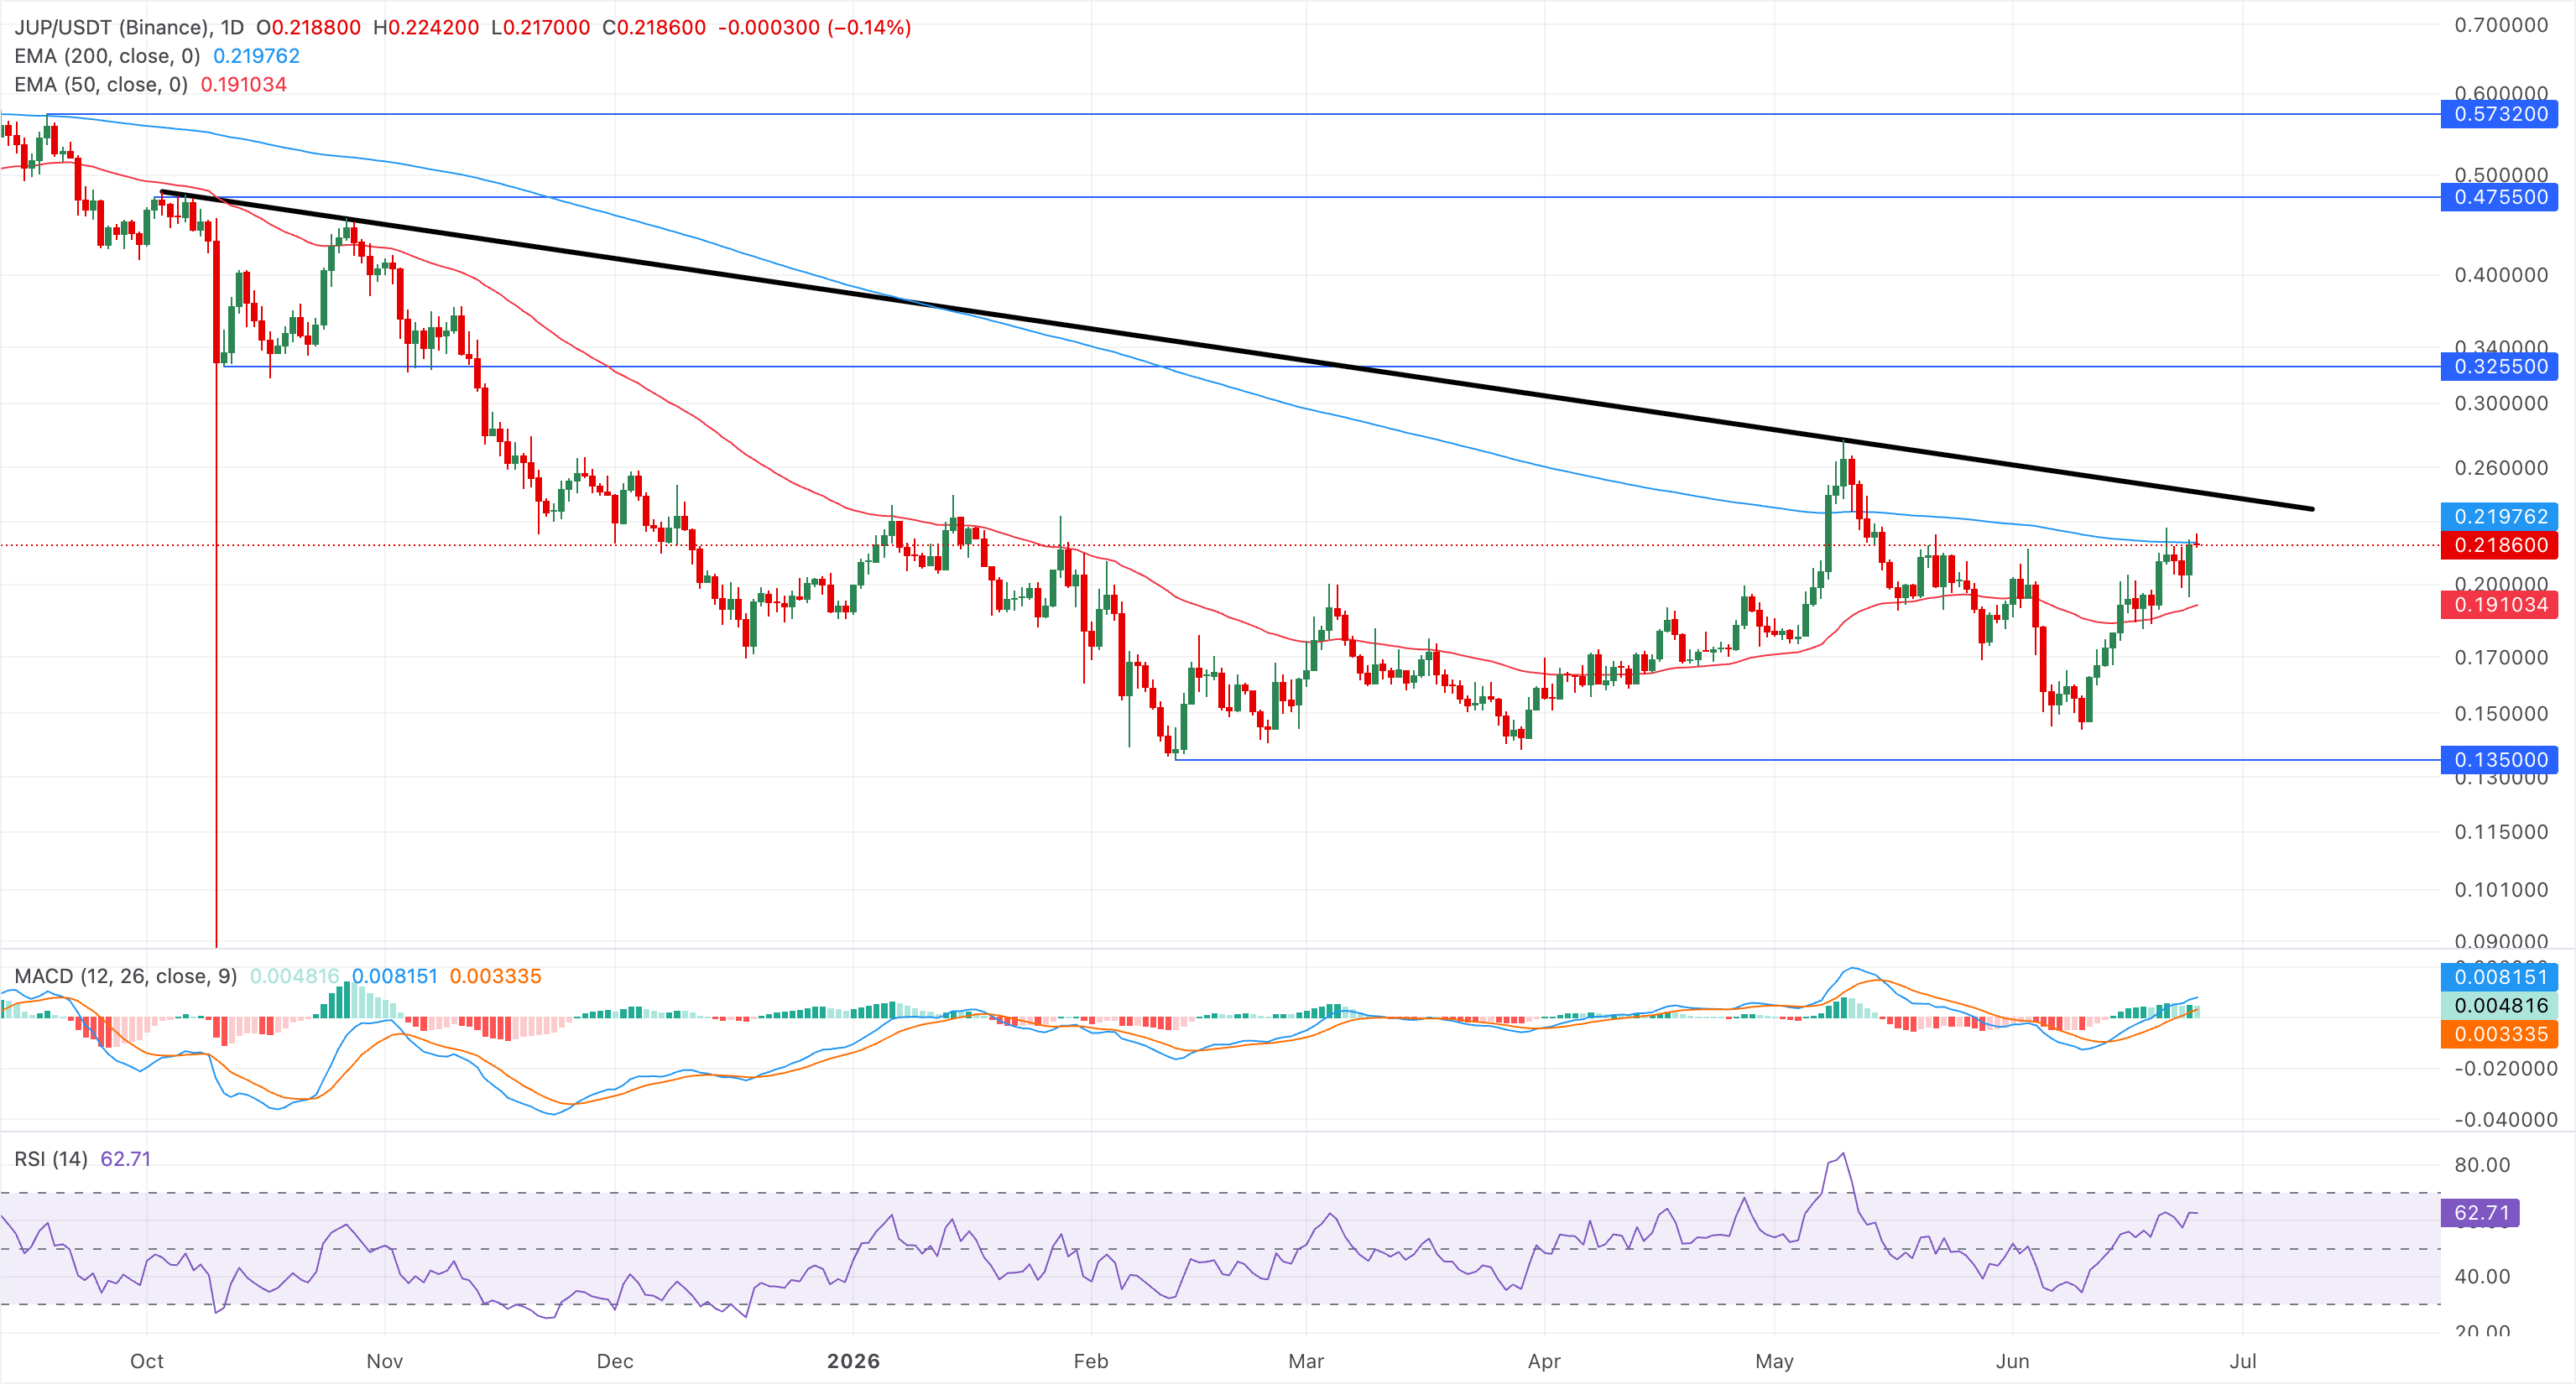
On the downside, initial support is seen at the 50-day EMA at $0.1910, and a daily close back below this level would weaken the current recovery structure and expose the recent range lows.
(The technical analysis of this story was written with the help of an AI tool.)
Author

Vishal Dixit
FXStreet
Vishal Dixit holds a B.Sc. in Chemistry from Wilson College but found his true calling in the world of crypto.