Gold faces critical technical test after hawkish Fed rate hike

The Federal Reserve (Fed) delivered an expected 25 basis point (bps) rate hike to the 3.75%–4.00% range after the September meeting, while signaling that further tightening remains on the table due to elevated inflation. Gold reacted with an immediate sell-off, dropping over 1% toward $4,240 as higher Treasury yields and a stronger US Dollar (USD) created strong headwinds. However, with macro uncertainties surrounding fiscal pressures and economic growth lingering, the precious metal sits at a crucial technical pivot point that could either trigger a deeper breakdown toward $4,000 or set up an explosive multi-stage recovery.

The Fed's hawkish signal and immediate market impact
On September 16, the Fed raised its target rate by 25 bps to the 3.75%–4.00% range, with the decision passing unanimously by a 12–0 vote. The Fed noted that economic activity was expanding at a solid pace, domestic spending remained resilient, productivity growth was strong, and capital investment was robust. However, the critical sentence for Gold focused on inflation, with the US central bank stating that inflation remains elevated and that the policy action should support a timelier return toward its 2% objective.
The September dot plot in the Federal Open Market Committee (FOMC) Summary of Economic Projections (SEP) revealed that 12 of 18 policymakers see another 25-basis-point hike in 2026, while four see two additional hikes, and only two officials expect no further increases. In other words, 16 of 18 policymakers anticipate at least one more hike before the year ends — a stance significantly more hawkish than needed for a sustained Gold rally. Fed Chair Kevin Warsh reinforced this message, emphasizing that inflation remains too high and that the Fed's priority is restoring price stability. The immediate market reaction was straightforward: a hawkish Fed boosted the US Dollar and Treasury yields, putting direct pressure on Gold as the metal dropped over 1% after the decision, falling to around $4,240.
A macro tug-of-war: Why the reaction isn't so simple
Gold is currently being pulled in two different directions. On one side, higher US rates, a stronger US Dollar, higher Treasury yields, and expectations for additional tightening create a major headwind for a non-yielding asset like Gold. On the other side, elevated inflation risks, geopolitical uncertainty, and concerns surrounding the longer-term economic and fiscal environment remain supportive factors.
The World Gold Council recently noted that Gold's August rally was supported by ETF buying, futures activity, and a weaker US Dollar, while warning that the interaction between rising yields, fiscal pressures, and policy intervention remains critical for Gold's outlook.
The real question is not simply whether the Fed is bullish or bearish for Gold, but how far the Fed can push yields and the US Dollar before other macro forces push back. While the initial reaction was clearly bearish, markets trade expectations rather than the decision itself. A collapse toward $4,200 or even $4,000 followed by a complete reversal remains possible because markets trade the future consequences of policy decisions. If higher rates eventually slow the economy, inflation remains elevated, fiscal concerns persist, or markets question how high rates can realistically remain, the same Fed tightening that initially hurts Gold could eventually create a different macro environment. The first move shows what the market heard; the following days reveal what the market actually believes.
Technical levels and key price targets
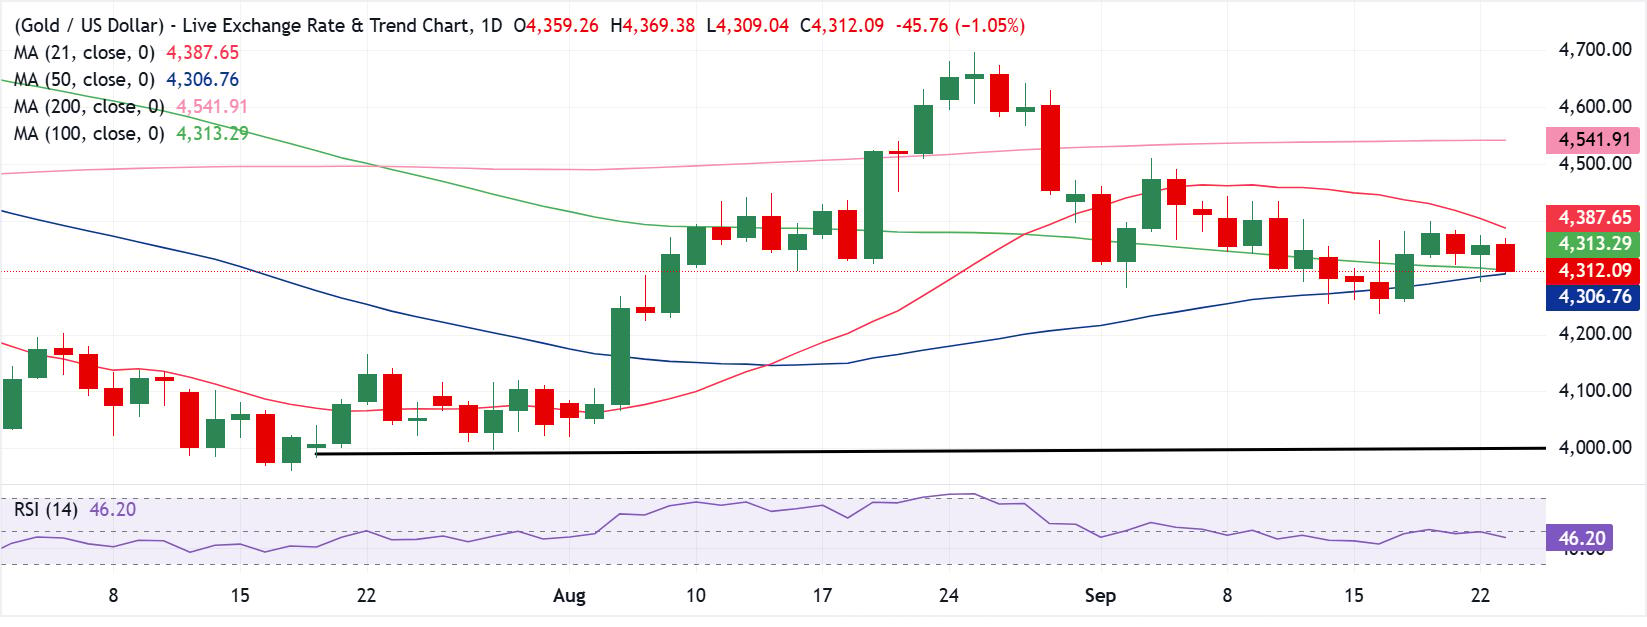
From a technical perspective, the price structure remains mixed. Gold has recovered above the 50-day and 100-day Simple Moving Averages (SMA), preventing an outright bearish breakdown. However, price remains below the 21-day and 200-day SMAs, while the Relative Strength Index (RSI) sits just below 50 on the daily chart, suggesting medium-term upside momentum has not yet returned.
A key level to watch is $4,320, which coincides with the 100-day SMA and serves as the primary technical battleground for the medium-term outlook. If Gold holds above this level, a meaningful recovery could unfold.
On the upside, the initial target is the $4,400 round figure, followed by $4,430 near the 21-day SMA, and $4,500 at the 200-day SMA. For the broader bullish trend to regain clear control, a daily or weekly breakout above $4,540 is critical, with further resistance pegged in the $4,600–$4,690 zone.
On the downside, if Gold loses its post-Fed reaction support near $4,240, risk shifts toward $4,100 and $4,000. Right now, $4,240 is the most critical level to monitor; a break below it could open the door to a much deeper correction.
Outlook: Trade the levels, not the headline
To put the entire picture together, the Fed delivered a widely expected 25 bps rate hike, but its underlying message carried greater weight. By signaling persistent inflation, economic resilience, and the potential for another rate increase in 2026, the central bank has set up a critical test for Gold.
A sustained break below $4,240 opens the door toward $4,100 and $4,000. Conversely, if buyers defend this support zone and reclaim $4,400, the Fed-driven sell-off could turn into the foundation for a larger recovery toward $4,540 and beyond. Market participants should focus on key technical levels rather than headlines and await clear confirmation.
(This article was created with the help of an Artificial Intelligence tool and reviewed by an editor. Know more.)
Gold FAQs
Gold has played a key role in human’s history as it has been widely used as a store of value and medium of exchange. Currently, apart from its shine and usage for jewelry, the precious metal is widely seen as a safe-haven asset, meaning that it is considered a good investment during turbulent times. Gold is also widely seen as a hedge against inflation and against depreciating currencies as it doesn’t rely on any specific issuer or government.
Central banks are the biggest Gold holders. In their aim to support their currencies in turbulent times, central banks tend to diversify their reserves and buy Gold to improve the perceived strength of the economy and the currency. High Gold reserves can be a source of trust for a country’s solvency. Central banks added 1,136 tonnes of Gold worth around $70 billion to their reserves in 2022, according to data from the World Gold Council. This is the highest yearly purchase since records began. Central banks from emerging economies such as China, India and Turkey are quickly increasing their Gold reserves.
Gold has an inverse correlation with the US Dollar and US Treasuries, which are both major reserve and safe-haven assets. When the Dollar depreciates, Gold tends to rise, enabling investors and central banks to diversify their assets in turbulent times. Gold is also inversely correlated with risk assets. A rally in the stock market tends to weaken Gold price, while sell-offs in riskier markets tend to favor the precious metal.
The price can move due to a wide range of factors. Geopolitical instability or fears of a deep recession can quickly make Gold price escalate due to its safe-haven status. As a yield-less asset, Gold tends to rise with lower interest rates, while higher cost of money usually weighs down on the yellow metal. Still, most moves depend on how the US Dollar (USD) behaves as the asset is priced in dollars (XAU/USD). A strong Dollar tends to keep the price of Gold controlled, whereas a weaker Dollar is likely to push Gold prices up.
Author

Dhwani Mehta
FXStreet
Residing in Mumbai (India), Dhwani is a Senior Analyst and Manager of the Asian session at FXStreet. She has over 10 years of experience in analyzing and covering the global financial markets, with specialization in Forex and commodities markets.