Gold Elliott Wave technical analysis [Video]
![Gold Elliott Wave technical analysis [Video]](https://editorial.fxstreet.com/images/Markets/Commodities/Metals/Gold/stack-of-golden-bars-in-the-bank-vault-60756080_XtraLarge.jpg)
Gold Elliott Wave analysis
Gold is expected to continue the bullish cycle from September 2022 as it tries to complete the last leg of the cycle before a major pullback begins. After recovering about half of the sell-off in November, the rally has stalled and the commodity looks for the right momentum to lift again.
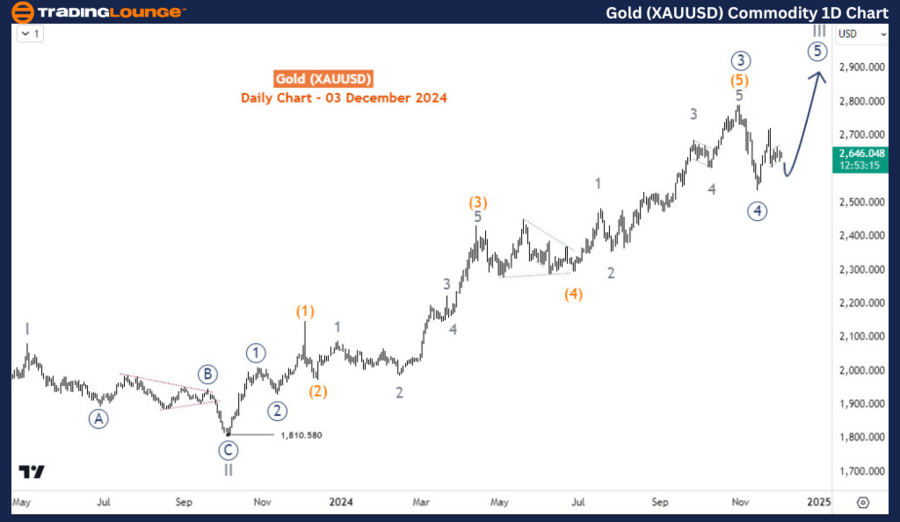
Daily chart analysis
Gold has been bullish since September 2022 when it completed an over 2-year bearish correction at 1616. This bearish phase was identified as the supercycle degree wave (IV). From September 2022, the supercycle degree wave (V) began and has led the commodity to multiple record highs since it broke the previous in May 2023. Meanwhile, wave II of (V) ended at 1810 in October 2023 as the daily chat captured, Further rallies have ensued toward the completion of wave III of (V). The fast sell-off in November 2024 marked the wave ((4)) of III. While not writing off the likelihood of wave ((4)) extending lower to prices below 2540, we can focus now on the wave ((5)) of III developing to another record high. When wave III ends, a much bigger pullback should follow.
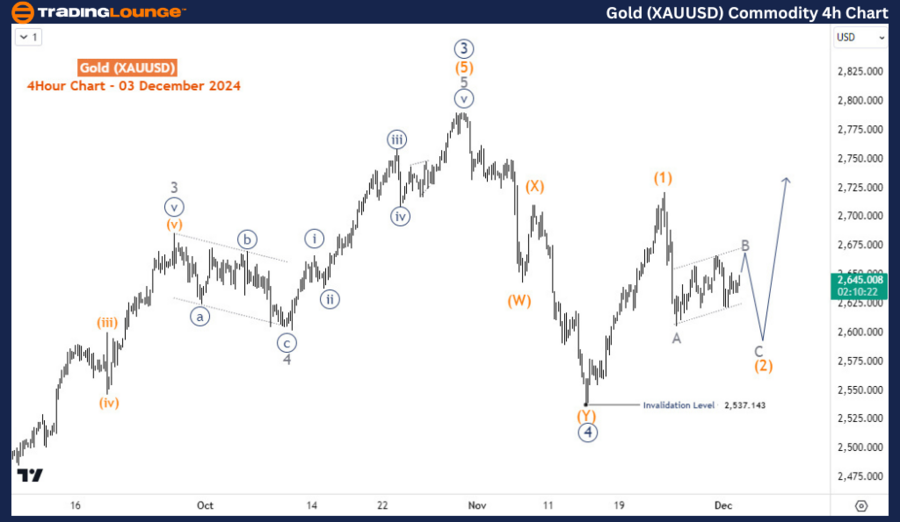
Four-hour chart analysis
On the H4 chart, we reckon that silver prices might still be in wave (2) of ((5)). The current bounce from late November is probably for wave B. Thus, another decline could follow for wave C of (2). If the dip ends above 2537, rallies should follow for wave (3). However, if 2537 is breached, we can expect wave ((4)) to extend lower to 2500 or below.
Gold Elliott Wave technical analysis [Video]
Author

Peter Mathers
TradingLounge
Peter Mathers started actively trading in 1982. He began his career at Hoei and Shoin, a Japanese futures trading company.


