Gold drops below $5,000 as inflation data triggers Dollar strength
Gold (XAUUSD) is consolidating below the $5,000 mark as shifting macro conditions pressure recent gains. The metal initially advanced on expectations that Kevin Warsh could steer the Fed toward a more dovish stance, weakening the Dollar and lifting gold. However, stronger-than-expected U.S. inflation data reversed that move, triggering Dollar strength and renewed downside in gold. While geopolitical tensions briefly supported safe-haven flows, those gains faded quickly. With price hovering near $4,900, gold continues to consolidate as markets reassess the policy outlook and inflation risks.
Gold pulls back as Dollar regains strength on inflation surprise
Gold is facing renewed pressure as price stalls near the $4,900 level, with repeated upside attempts failing to gain traction. The metal initially rallied on market expectations that Kevin Warsh could guide the Fed toward a more dovish stance. This outlook weighed on the U.S. Dollar, allowing gold to briefly test the $5,100 zone. However, that momentum faded as fresh inflation data reduced hopes for near-term easing.
At the same time, escalating tensions in the Middle East and the ongoing Russia-Ukraine conflict added to safe-haven demand. Concerns also grew over delayed U.S. economic data following the recently resolved government shutdown. These developments helped lift gold prices earlier in the day. Geopolitical risk often enhances gold’s appeal, particularly when policy signals are unclear. Yet the initial strength failed to hold, and gold struggled to extend its gains.
Market dynamics shifted after the ISM Services PMI pointed to rising inflation pressures in the U.S. economy. The stronger-than-expected print triggered a tech-led sell-off in equities, fueling renewed strength in the Dollar and prompting a sharp reversal in gold. At the same time, weakness in the Japanese Yen added to Dollar gains, contributing to gold’s decline. As safe-haven flows shifted toward the U.S. Dollar, gold lost its earlier support. This shift in sentiment exposed gold to additional weakness as momentum stalled near resistance.
Gold consolidates within expanding wedge as market volatility rises
The gold chart below shows price trading within a well-defined ascending broadening wedge. The pattern began forming in late 2024 and has guided price action throughout 2025. Each rally has expanded the range, with higher highs and higher lows defining the structure. The widening formation reflects increasing volatility and uncertainty at higher levels. Price remains well within the wedge, suggesting that directional clarity will depend on how it interacts with the upper and lower boundaries.
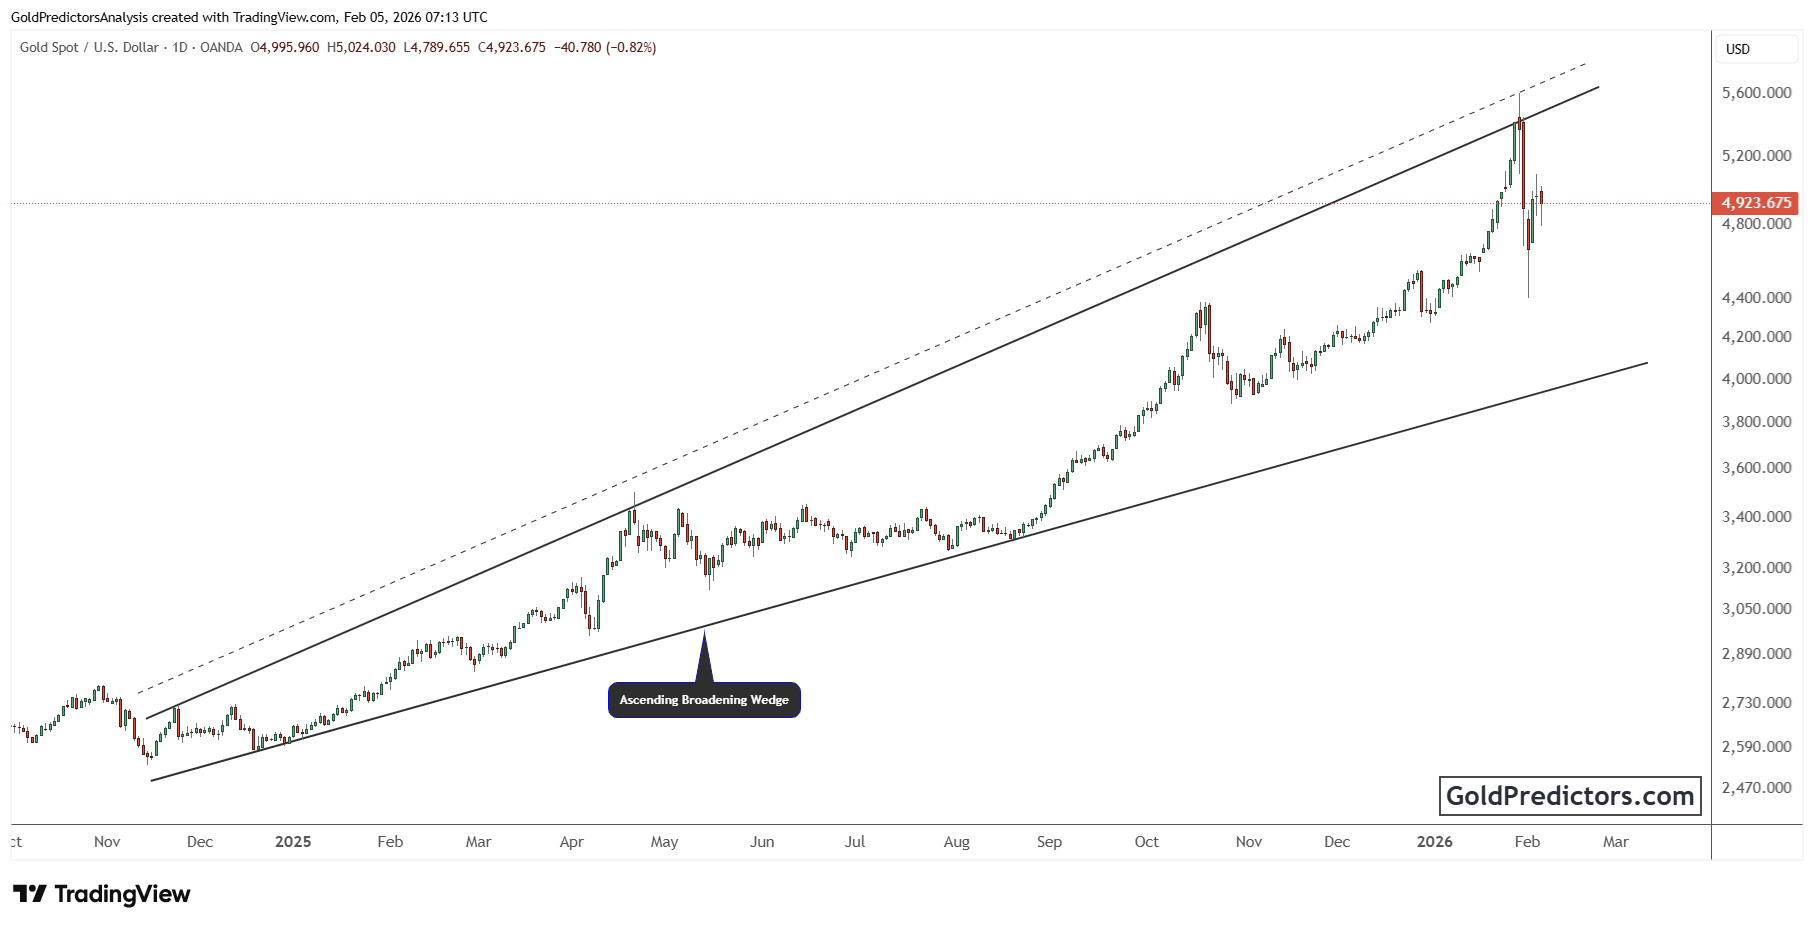
Gold extended its uptrend into January 2026, where it tested the upper boundary of its ascending broadening wedge. Price action climbed steadily through late 2025, carrying momentum into early 2026. Once gold tested the top boundary near $5,600, it faced strong resistance and reversed sharply. The reversal formed a long upper wick, indicating profit-taking and a shift in short-term sentiment.
Despite the rejection, gold is holding above key support near $4,800. The broader structure remains intact, and the sharp drop has not broken the wedge pattern. If gold stabilizes above this support, the uptrend may resume, with the upper boundary still acting as a potential target on renewed strength.
Gold forecast: Inflation shift and Dollar gains delay further upside
Gold remains under pressure as Dollar strength and fading rate-cut expectations limit upside potential. Although geopolitical risks initially boosted safe-haven demand, that support quickly shifted toward the Dollar. Price failed to break above resistance near $5100, exposing the metal to further weakness. Still, gold is holding above the lower wedge boundary, leaving the broader structure technically intact. A firm close below $4,800 could increase downside risk, while stability above this level may keep the bullish pattern in play.
Unlock exclusive gold and silver trading signals and updates that most investors don’t see. Join our free newsletter now!
Author

Muhammad Umair, PhD
Gold Predictors
Muhammad Umair is a financial markets analyst and investor who focuses on the forex and precious metals markets.