Gold cycle since September 2022 low calling for more upside

More than two years back, we were calling Gold to end a Zigzag Elliott Wave correction in the blue box area and resume the rally. Zigzag is a 5-3-5 Elliott wave structure in which wave A and C are in 5 waves and wave B is in 3 waves. Blue Boxes are High-Frequency areas and are based in a relationship of sequences, cycles and calculated using Fibonacci extensions. We refer to them as High Frequency trading areas, mainly because at Blue Boxes majority of the times, both buyers and sellers agree in the direction of the next moves and, hence why they present high probability and low-risk opportunities to enter the market in the direction of the trend. Let’s take a look at the weekly Elliott wave chart of Gold from September 2022.
Gold weekly chart September 2022
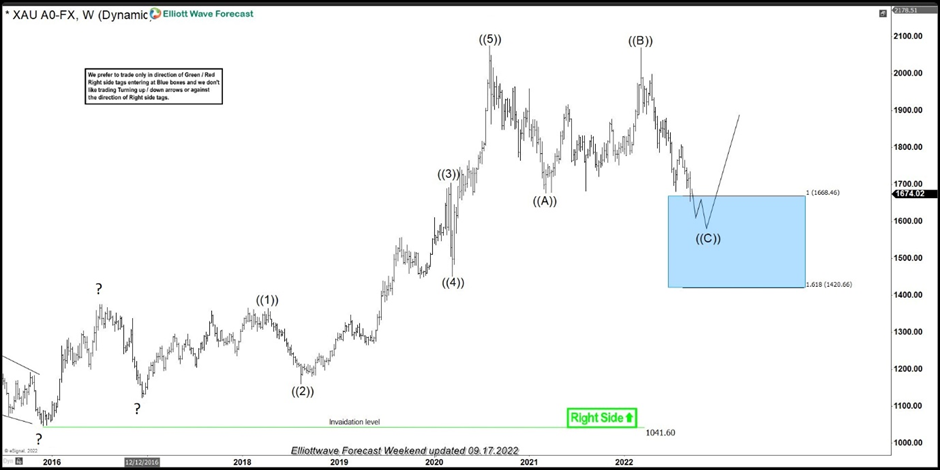
Gold cycle from 2015 low ended at $2075.14 on 08.03.2020 high. Following this peak, $XAUUSD started a pullback which lasted more than two years. Back in September 2022 (as shown in the chart above), we expected the yellow metal pullback to complete in the blue box area between $1668.46 – $1420.66 and rally to resume for a new high above 08.03.2020 high or for a three waves reaction higher at least. $1420.66 being the 161.8% Fibonacci extension of (( A )) related to (( B )) was the invalidation level which we expected to hold.
Gold weekly chart January 2025
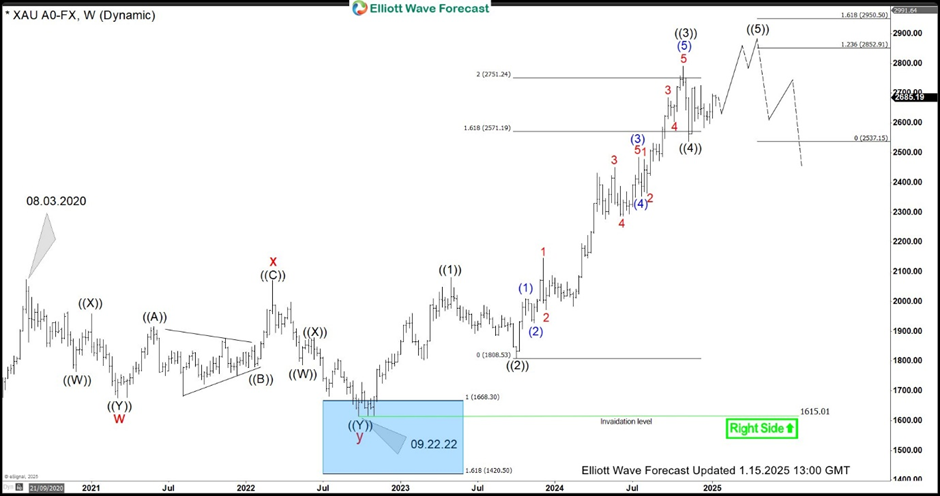
Gold buyers indeed appeared in the blue box as expected and it started a rally which has lasted 27 months but is still not over yet. Blue box low was seen on 09.22.2022 at $1615.01 and since then we see Gold rally to be in fifteen (15) swings. Gold made a new all-time high, rally is extended as third wave went past 161.8 Fibonacci extension of wave (( 1 )) related to wave ((2)) but we still expect more upside because fifteen (15) is part of a corrective sequence and we need at least 1 more high to make it seventeen (17) swings and hence complete the cycle since 09.22.2022 low. As dips hold above wave (( 4 )) low at $2536.89, we are expecting more upside in Gold toward $2852.91 – $2950.50 area to complete wave ((5)). Following this, there should be a larger 3 waves pull back to correct the cycle from 09.22.2022 low. In the unlikely event of a break below $2536.89, Gold should still be in wave ((4)) and can see a test of $2474.41 – $2318.80 area before it turns higher in wave ((5)).
Author

Elliott Wave Forecast Team
ElliottWave-Forecast.com


