Gold bulls regain control as price attacks $4,600

Gold has entered a decisive bullish phase after reclaiming the $4,500-$4550 area and extending higher toward the $4,600 psychological barrier. The Daily time frame chart shows a clear improvement in market structure, with successive higher highs and higher lows.
The move is being reinforced by a combination of a softer US dollar, changing expectations around US monetary policy, lower Treasury yields following the US Treasury's expanded long-duration debt buyback programme, and renewed concern about US fiscal/debt sustainability. Spot gold reached approximately $4,604 on Friday, its highest level since May 15, while gold was on course for a third consecutive weekly gain.
The key technical development is the reclaim of the $4,500–$4,550 zone, which has transformed an important former resistance area into the first major support region.
Primary view: bullish above $4,500–$4,550.
Near-term objective: $4,635–$4,670.
Next major upside zone: $4,720–$4,770.
Bullish structure invalidation: Sustained weakness below approximately $4,450, with a more important failure below $4,390.
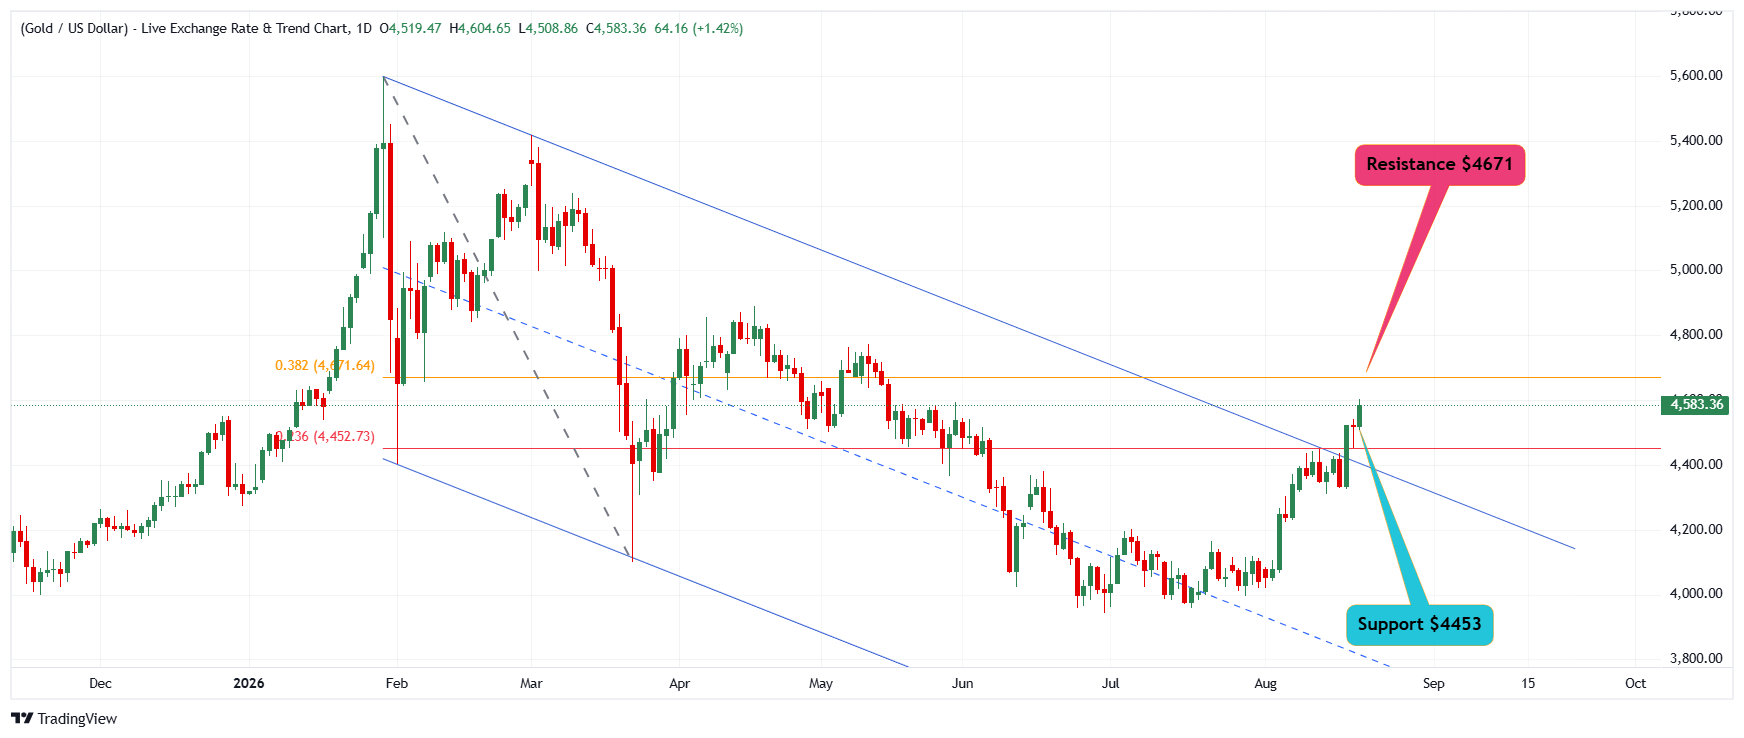
Market structure
D1 — Major Trend Transition
The daily chart shows a significant structural recovery.
Gold declined sharply from the January peak and subsequently formed a prolonged corrective/downtrend structure through June and July. The market then established a base around the $4,050–$4,100 region.
The August advance has changed the character of the market:
Higher low established around the $4,050–$4,100 area.
Price reclaimed $4,225.
Subsequently broke above $4,390.
Price then accelerated through $4,500.
Current price reached $4604 and is testing local demand area $4,560.
This represents a transition from distribution/correction → accumulation → bullish expansion.
The D1 chart therefore supports a medium-term bullish reversal rather than merely a short-lived intraday rally.
Key drivers behind the prevailing bullish momentum
1. US Dollar weakness
A softer dollar is providing an important tailwind for gold.
The dollar was trading near a three-month low on August 21, while the 10-year Treasury yield was around 4.69%.
For gold, the combination is constructive because a weaker dollar reduces the metal's cost for non-US investors and generally improves demand for dollar-denominated bullion.
2. Treasury buybacks and fiscal concerns
One of the most important catalysts behind the latest acceleration has been the US Treasury's decision to expand buybacks of longer-dated government securities.
The move contributed to lower Treasury yields initially and helped weaken the dollar, creating a favourable environment for gold.
More importantly, the market is increasingly focusing on the sustainability of US government debt and borrowing requirements.
This is creating a second channel of demand for gold:
Gold is increasingly being treated not only as an interest-rate trade, but also as a hedge against fiscal and currency risks.
3. Changing US monetary-policy expectations
Recent price action indicates that expectations for aggressive US monetary tightening have moderated.
Gold has historically benefited when real yields and the opportunity cost of holding a non-yielding asset decline. Current market conditions are therefore more supportive than they were during periods of renewed hawkish Fed expectations.
However, this remains a major risk factor: a renewed rise in US inflation expectations, Treasury yields or hawkish Fed guidance could trigger a correction.
4. Central-bank demand
The structural demand story remains supportive.
The World Gold Council's 2026 central-bank survey found that 89% of reserve managers expect global central-bank gold holdings to increase over the next 12 months, while 45% expect their own gold holdings to rise.
H1 2026 data also showed significant purchases from Poland, Uzbekistan, China and Kazakhstan.
This provides an important long-term floor beneath the market.
5. Investment demand
Gold ETF activity remains an important variable.
The World Gold Council notes that investment demand should remain constructive during the remainder of 2026, although Western ETF flows remain sensitive to real yields, monetary-policy expectations and the US dollar.
Chinese gold ETFs also recorded positive flows in July, with holdings increasing by approximately 5 tonnes, while inflows continued into August.
Fundamental assessment
Bullish Factors
Softer US dollar.
Falling/volatile Treasury yields.
Growing concern over US fiscal sustainability.
Expectations surrounding future monetary-policy easing.
Persistent central-bank accumulation.
Renewed investment demand.
Geopolitical uncertainty.
Strong technical momentum attracting trend-following capital.
Fundamental Headwinds
The bullish case is not without risks.
Gold is now significantly extended after its rapid August advance. Gold had gained approximately 4.2% during the week and had moved above its 200-day moving average aligning with psychological zone $4500
At elevated prices:-
Jewellery demand can weaken.
Profit-taking can increase.
ETF flows can reverse quickly.
A rise in real yields can pressure gold.
A stronger US dollar could trigger a sharp correction.
Hawkish Federal Reserve communication could temporarily challenge the bullish trend.
Therefore, the fundamental backdrop is bullish, but the risk/reward of chasing the market at $4,600 is less attractive than buying a controlled retracement.
Technical analysis
Immediate resistance
$4,600–$4,605.
This is the immediate psychological and technical barrier.
The price currently testing approximately $4,594–$4,595 recovering after a retracement to local demand area $4560, with the recent high around $4,604.
A sustained H1/H4 close above $4,605 would strengthen the continuation setup.
$4,635
The H1 chart identifies approximately $4,635 as the next visible resistance/extension level.
A decisive breakout above $4,605 could therefore open:
$4,605 → $4,635
$4,670–$4,720
Above $4,635, the next important upside area is approximately $4,670, followed by the major daily resistance region around $4,720–$4,750.
The D1 chart shows $4,721.73 as a significant historical reference level.
Key support zones
First Support: $4,570–$4,575
This is the first area to monitor for shallow intraday pullbacks.
Holding this zone would indicate that buyers remain aggressive.
Second support: $4,540–$4,550.
This is a more important breakout/retest region.
A retracement into this zone followed by bullish price action would provide a higher-quality dip-buying opportunity than buying directly at $4,600.
Major support: $4,500–$4,510.
This is the most important short-term structural level.
The market's ability to remain above $4,500 is crucial to maintaining the current bullish breakout narrative.
Deeper support: $4,450–$4,480.
A deeper correction into this area would not necessarily invalidate the bullish trend.
Instead, it could represent a normal retest of the recent breakout structure.
Major structural support: $4,390–$4,400.
A sustained break below this zone would materially weaken the current bullish structure.
Short-term outlook
The short-term trend remains bullish above $4,500.
The preferred strategy is therefore:
Buy dips rather than sell rallies, unless price produces a confirmed bearish structural reversal.
The bullish scenario remains valid while the market continues to form higher lows above the $4,500–$4,510 breakout region.
A sustained move above $4,605 would shift the focus toward:
$4,635 → $4,670 → $4,720/4,750
Conversely, a sustained daily close back below $4,500 would warn of a failed breakout and increase the probability of a deeper retracement toward $4,450–$4,390.
Note: These are my personal readings based on price action and technical studies and not a trading advice.
Author

Sunil Kumar Dixit
SK Charting
Sunil Kumar Dixit is Chief Technical Strategist and founder of SK Charting, a research firm based in India. He tracks Precious Metals, Energy, Indices and Currency Pairs. He also participates as an expert panellist on Channel Television, Nigeria.