Gold breaks $4,550 as Dollar weakness offsets higher yields

Summary
- Gold's 4-hour structure remains decisively bullish following the breakout above the former $4,436 swing resistance.
- Momentum and volatility are expanding together, strengthening the technical credibility of the breakout.
- $4,579 is the immediate upside target, followed by the $4,601-$4,617 resistance cluster.
- Dollar weakness and reserve-diversification demand are currently more influential than the negative effect of high Treasury yields.
- The first tactical warning would be a return below $4,548, while a break below $4,436 would materially weaken the current breakout structure.
Fundamental analysis
Gold is currently trading in an unusual but analytically important cross-asset regime in which traditional macro relationships have partially broken down.
Normally, higher Treasury yields increase the opportunity cost of holding a non-yielding asset such as gold and tend to strengthen the U.S. dollar, creating a dual headwind for bullion. However, this transmission mechanism is currently incomplete.
Long-term U.S. yields remain elevated, with the 10-year around 4.7% and the 30-year near 5.25%, yet the dollar has weakened toward a three-month low while gold continues to rally. This divergence suggests that the composition of yield increases matters more than the absolute level.
A growing share of long-end yield pressure appears to reflect fiscal concerns, rising government debt, inflation uncertainty, and an elevated term premium rather than purely tighter Federal Reserve expectations. When yields rise due to sovereign risk and term premium expansion, they do not necessarily strengthen the dollar in the same way as policy-driven tightening cycles.
The Treasury’s recent bond buyback operations highlight this tension. While initially supportive for yields, the effect has been temporary, and long-end yields have rebounded without corresponding dollar strength. This weakens the traditional inverse relationship between yields and gold.
The Federal Reserve remains a key constraint. July FOMC minutes showed increased concern about inflation, with some policymakers open to further tightening if inflation remains above target. At the same time, resilient labor data reduces urgency for rate cuts, keeping policy uncertainty elevated.
Energy prices add another layer of complexity. Higher oil prices can push inflation expectations higher, lifting nominal and real yields, which is typically negative for gold. However, the same dynamic increases gold’s appeal as an inflation and geopolitical hedge.
Institutional demand is providing a structural offset to rate-related headwinds. World Gold Council data show that global physically backed gold ETFs recorded approximately $3 billion in net inflows in July after prior outflows, bringing holdings to around 4,068 tonnes. Europe led inflows, followed by Asia, while North America showed only modest participation—suggesting potential for further upside if U.S. investors re-engage.
Central banks remain a critical pillar of demand. Q2 purchases reached approximately 289 tonnes, one of the strongest second-quarter readings on record. Reserve managers continue to signal long-term diversification away from the U.S. dollar, with 89% expecting higher global gold holdings and a record share planning to increase their own allocations.
Importantly, roughly three-quarters of surveyed central banks expect the dollar’s share of global reserves to decline over the next five years. This does not imply dollar replacement, but it does indicate persistent marginal demand for gold as a reserve diversification asset.
Overall, the fundamental backdrop supports gold not because yields are low, but because the drivers of high yields are increasingly fiscal and structural rather than purely monetary tightening.
Technical analysis
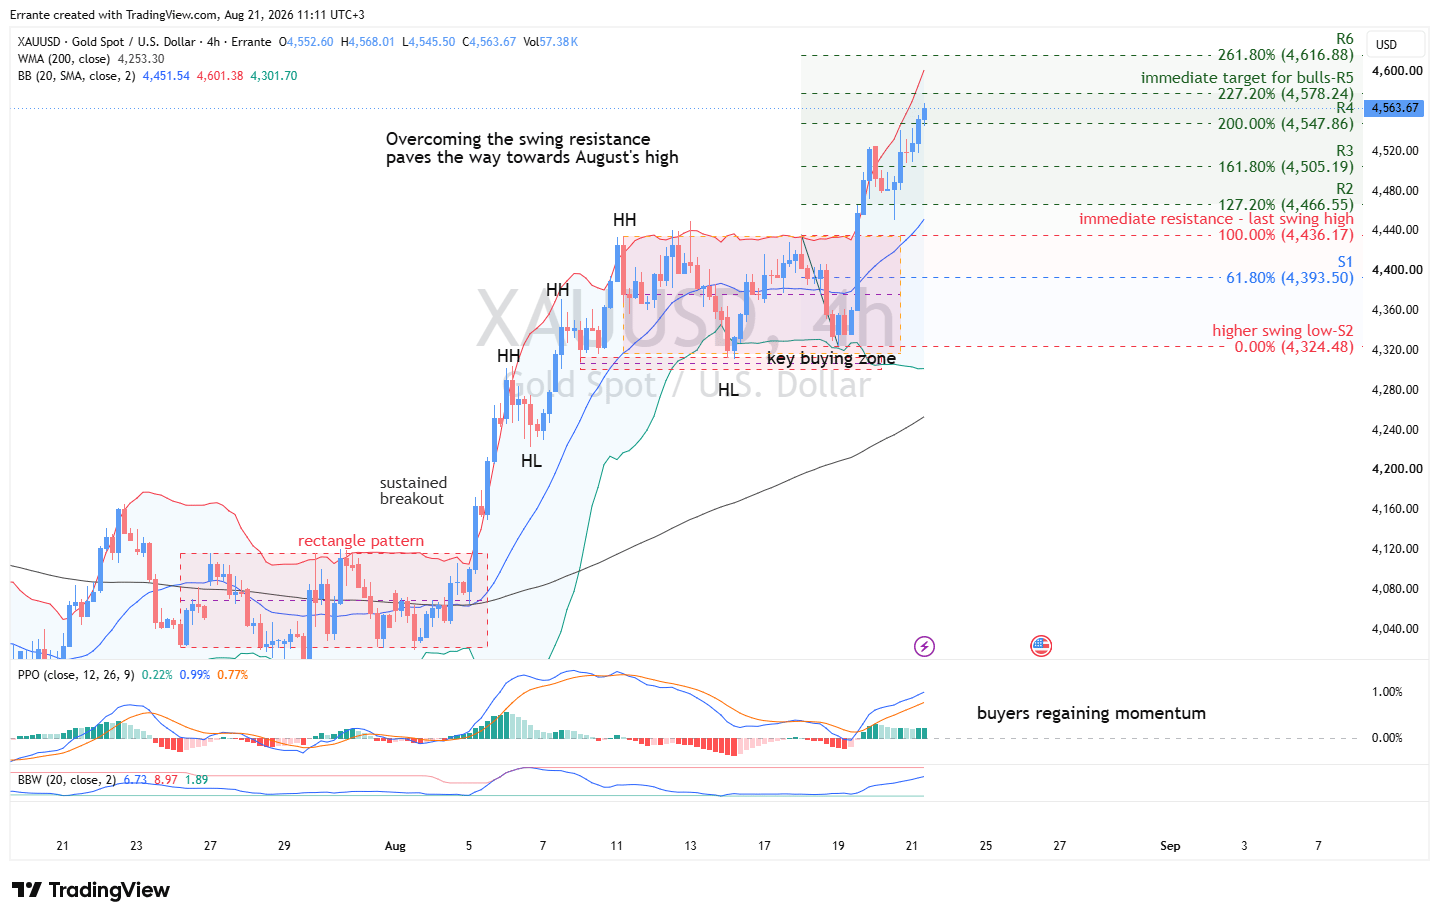
Gold remains in a strong bullish 4-hour trend after decisively breaking above the prior swing resistance at $4,436 and extending through successive Fibonacci expansion levels at $4,467, $4,505, and $4,548.
Price is currently trading around $4,564, continuing to form a clear sequence of higher highs and higher lows. It remains well above the rising 200-period WMA near $4,253, confirming that the broader trend structure is strongly positive.
Momentum conditions reinforce the breakout. The PPO is firmly above the zero line with an expanding positive histogram, indicating accelerating upside momentum rather than exhaustion. At the same time, Bollinger Band Width is expanding after a prior contraction phase, confirming a volatility expansion regime consistent with trend continuation.
Price is also trading near the upper Bollinger Band, which reflects strength but also indicates that the move is becoming tactically extended. In strong trends, price can remain near the upper band for prolonged periods, but this typically reduces short-term entry efficiency rather than signaling immediate reversal.
From a structural perspective, the breakout above $4,436 converted prior resistance into a potential support zone, strengthening the bullish continuation case. The market has since cleared the 200% Fibonacci extension at $4,548, leaving $4,579 as the next key resistance level.
Above that, the $4,601-$4,617 zone represents a major confluence area, combining the upper Bollinger Band and the 261.8% Fibonacci extension.
The broader technical interpretation is that gold is in a mature but still active impulse phase. Trend direction remains clearly bullish, but distance from the mean and rapid extension increase the probability of short-term consolidation or pullbacks.
Key levels
Resistance
- $4,579 – Immediate Fibonacci extension target.
- $4,601 – Upper Bollinger Band resistance.
- $4,617 – Major 261.8% extension target.
Support
- $4,548 – 200% Fibonacci breakout support.
- $4,505 – Secondary Fibonacci support.
- $4,467 – Prior extension support.
- $4,436 – Key breakout polarity level.
- $4,394 – Deeper corrective support.
- $4,324 – Structural swing support.
- $4,253 – 200-period WMA (trend baseline)
Technical outlook
The bullish structure remains intact as long as price holds above $4,436. A sustained break above $4,579 would confirm continuation toward $4,601-$4,617, while a failure back below $4,548 would signal short-term exhaustion.
A decisive break below $4,436 would represent a failed breakout and materially weaken the current bullish structure, shifting focus toward deeper support at $4,394 and $4,324.
Overall, the technical picture remains bullish but extended, favoring continuation with intermittent consolidation phases rather than a straight-line advance.
Author

Ali Mortazavi
Errante
BEc, CMSA, Member of IFTA - International Federation of Technical Analysis, Associate Member of STA - Society of Technical Analysis (UK).