Gold breakout signals long-term rally amid global risks and market volatility

Gold (XAUUSD) prices have been surging relentlessly, driven by geopolitical tensions, inflation fears, and uncertain global trade dynamics. After consolidating for years, gold finally broke out of a long-term pattern, triggering a sharp rally. The current macroeconomic environment continues to offer support and resistance to gold's movement. The metal remains a preferred safe haven, although recent developments warrant a cautious outlook.
Geopolitical tensions and strong US data create mixed drivers for Gold
Gold prices remain elevated due to global economic and political factors. The recent rise in the ISM Services PMI and strong US jobs data suggest economic resilience. This reduces fears of a US recession and strengthens the US Dollar. However, gold still benefits from its safe-haven appeal amid global uncertainty.
US-China trade tensions appear to be easing. US President Donald Trump hinted at potential trade deals soon. China also signaled openness to negotiations. These developments support market risk tolerance, but investors remain cautious due to Trump's unpredictable policies. Gold holds its ground as a hedge against policy surprises and volatility.
On the other hand, geopolitical risks continue to support gold. The Russia-Ukraine war intensifies, with attacks near Moscow and Kursk. Middle East tensions also persist. These conflicts increase demand for gold as a safe asset. Despite short-term profit-taking, the overall outlook for gold remains bullish due to strong fundamentals and persistent global risks.
Gold price breaks out of decade-long triangle pattern toward record highs
The monthly chart for gold shows a classic ascending triangle pattern that has developed over nearly a decade. This triangle had a base of higher lows connecting from 2015 through 2023, showing steady demand. The resistance of around $2,070 was held for multiple attempts but eventually gave way.
A breakout occurred in early 2024, marking the start of an explosive rally. This move was textbook with a strong breakout, quick retest, and rapid upside. The gold price climbed in a steep channel following the breakout, pushing through $2,400, $2,600, and $3,000 levels in just over a year.
By April 2025, the price peaked near $3,288. A red candle formed in that month, showing a pullback from the highs but still closing strongly above $3,240. This suggests consolidation may follow, but the trend remains bullish. The structure and volume behind the breakout point toward continued strength unless key levels break.
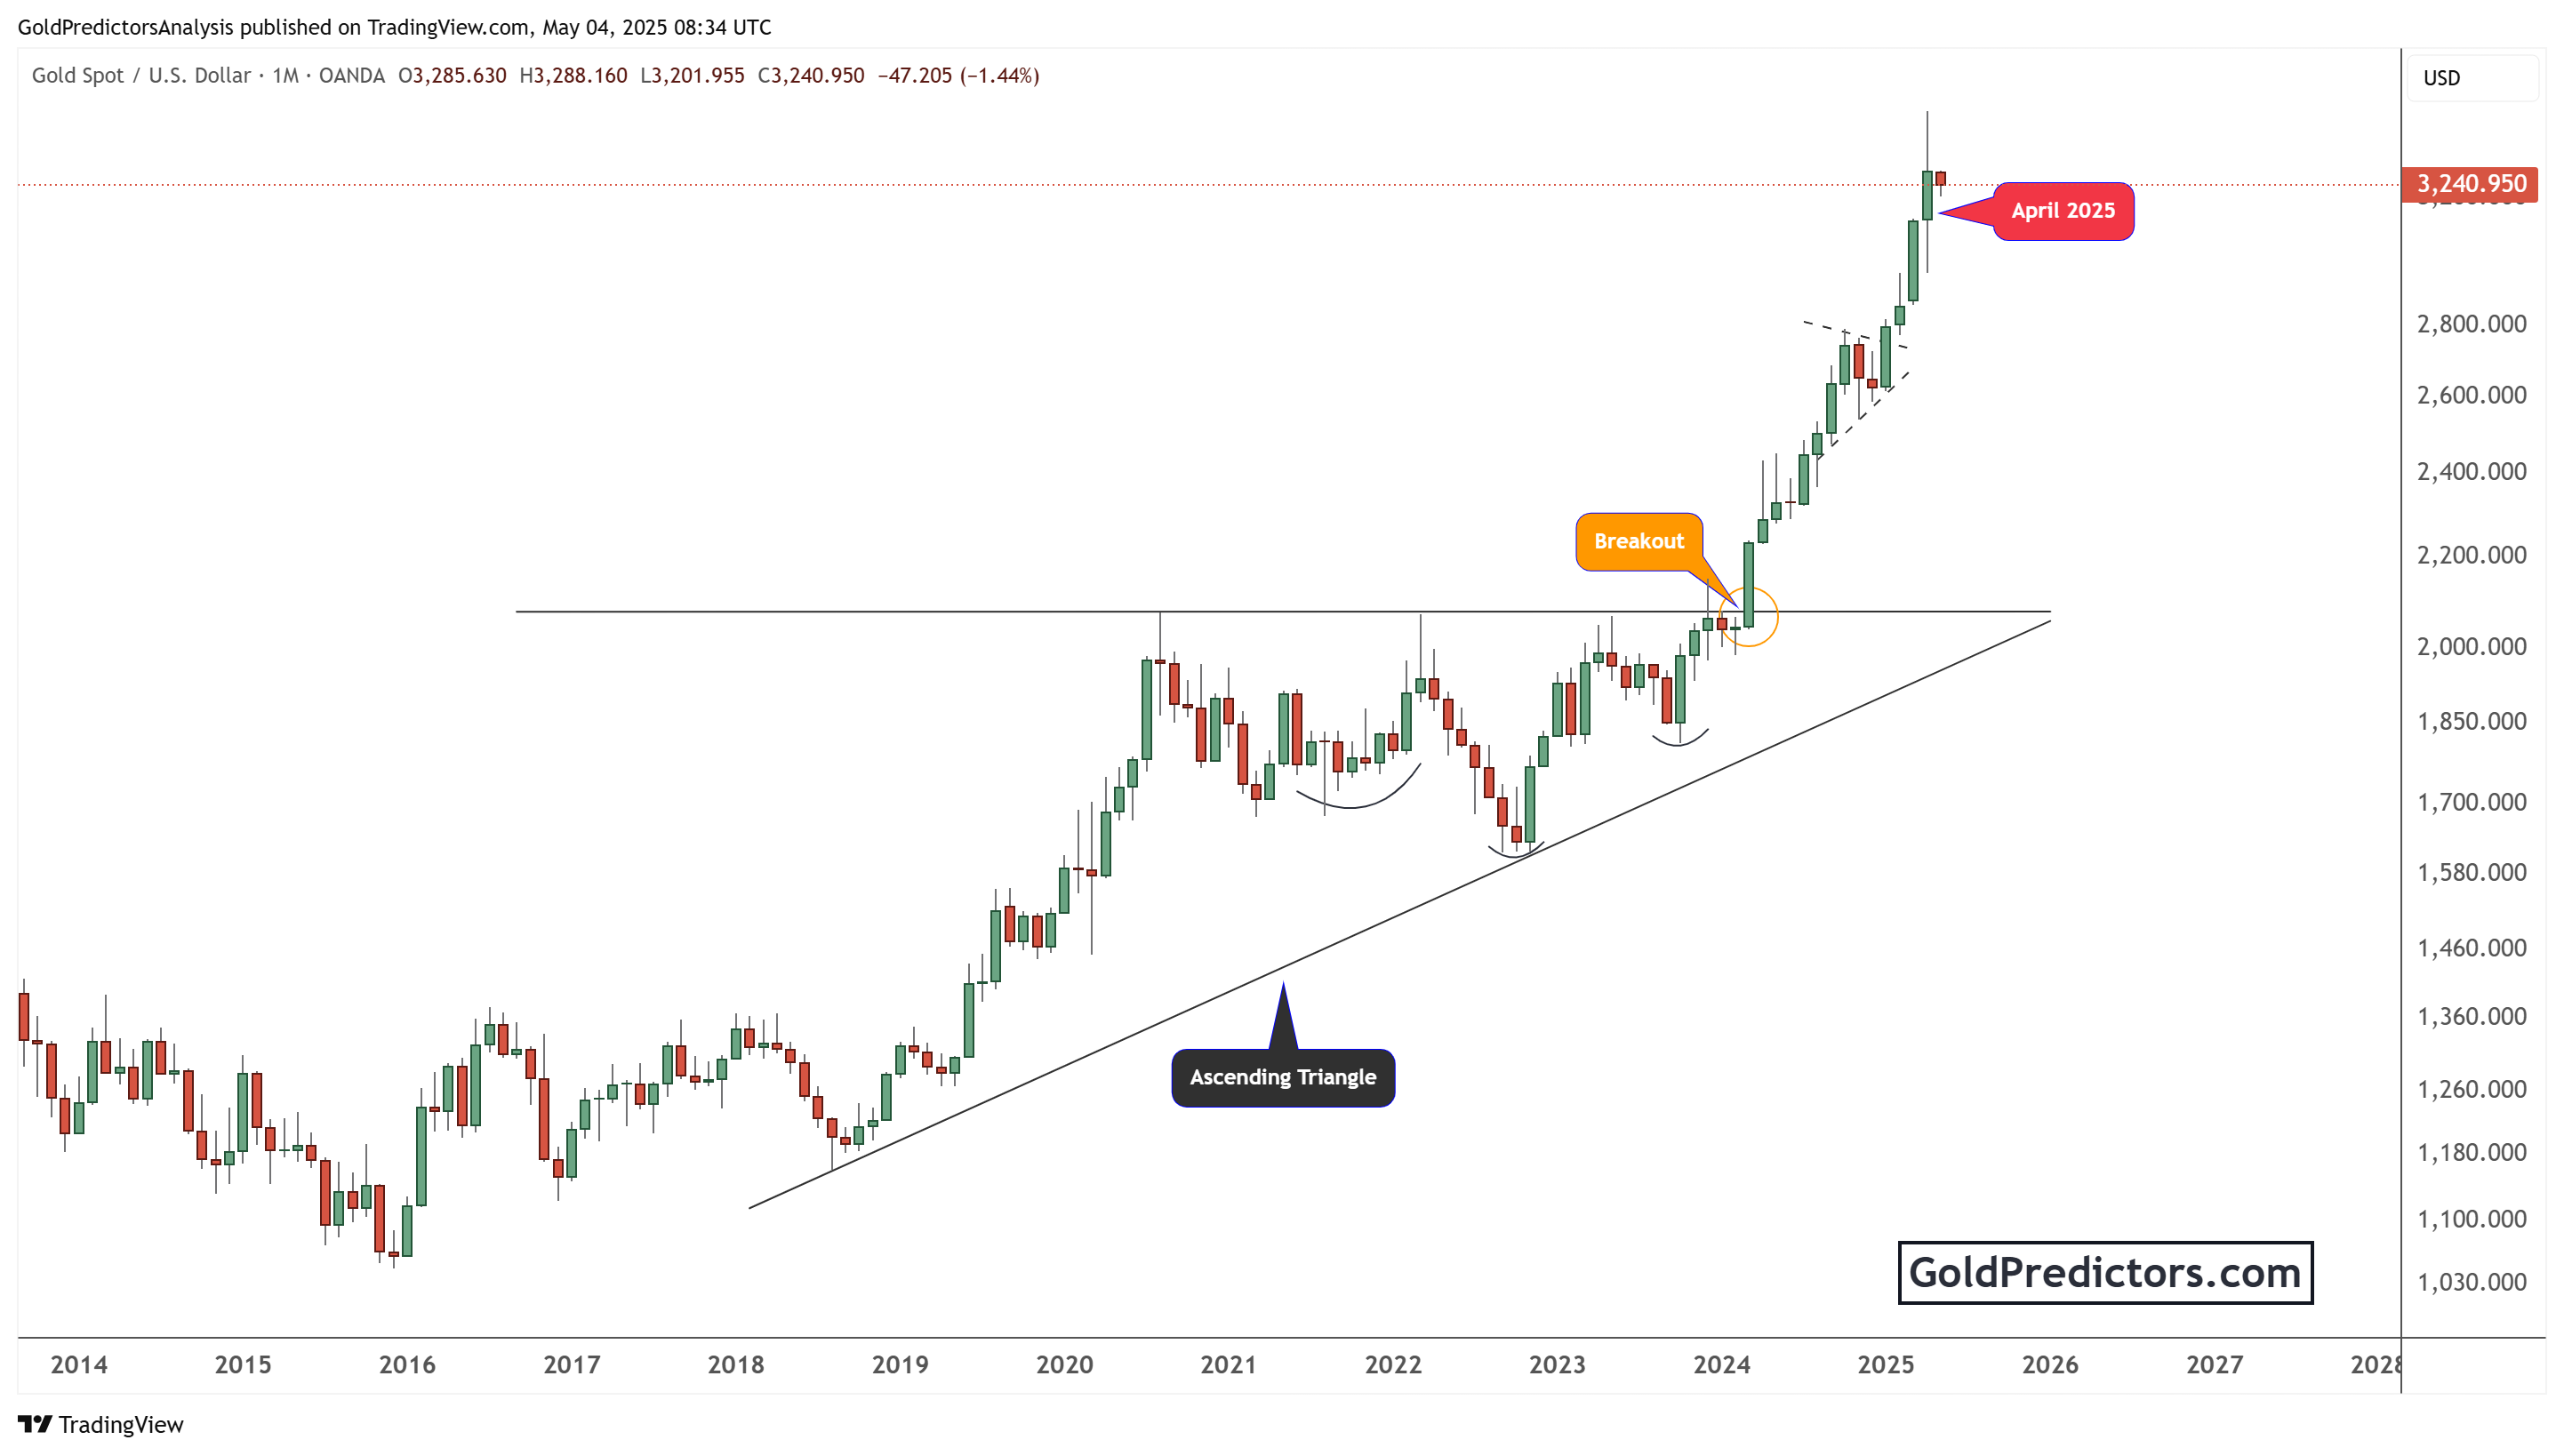
Traders should watch the $3,200 and $3,000 levels as short-term support. A failure to hold those levels may trigger a deeper correction, but bulls retain control as long as the price stays above the triangle breakout.
Gold outlook: Bullish momentum holds as long as key support levels remain intact
Gold remains in a strong uptrend, supported by solid fundamentals and a powerful technical breakout. Despite short-term pullbacks and mixed global signals, the metal continues to attract investors as a safe haven. Key support levels around $3,200 and $3,000 will be crucial in the coming weeks. The bullish momentum will likely continue as long as gold holds above these levels.
Unlock exclusive gold and silver trading signals and updates that most investors don’t see. Join our free newsletter now!
Unlock exclusive gold and silver trading signals and updates that most investors don’t see. Join our free newsletter now!
Author

Muhammad Umair, PhD
Gold Predictors
Muhammad Umair is a financial markets analyst and investor who focuses on the forex and precious metals markets.