Global recession: Canada’s economy and dollar in focus

Since the outbreak of the pandemic, it's well known that every major central bank has been injecting record amounts of liquidity into markets in hopes of maintaining stability and liquidity. However, we find that all too often analysts forget to look past the "big four" central banks (US Fed, ECB, BOJ, BOE). The Bank of Canada's monetary interventions in 2020 have been flying under the radar. Below, we've created visualizations to represent the position Canada finds itself in today.
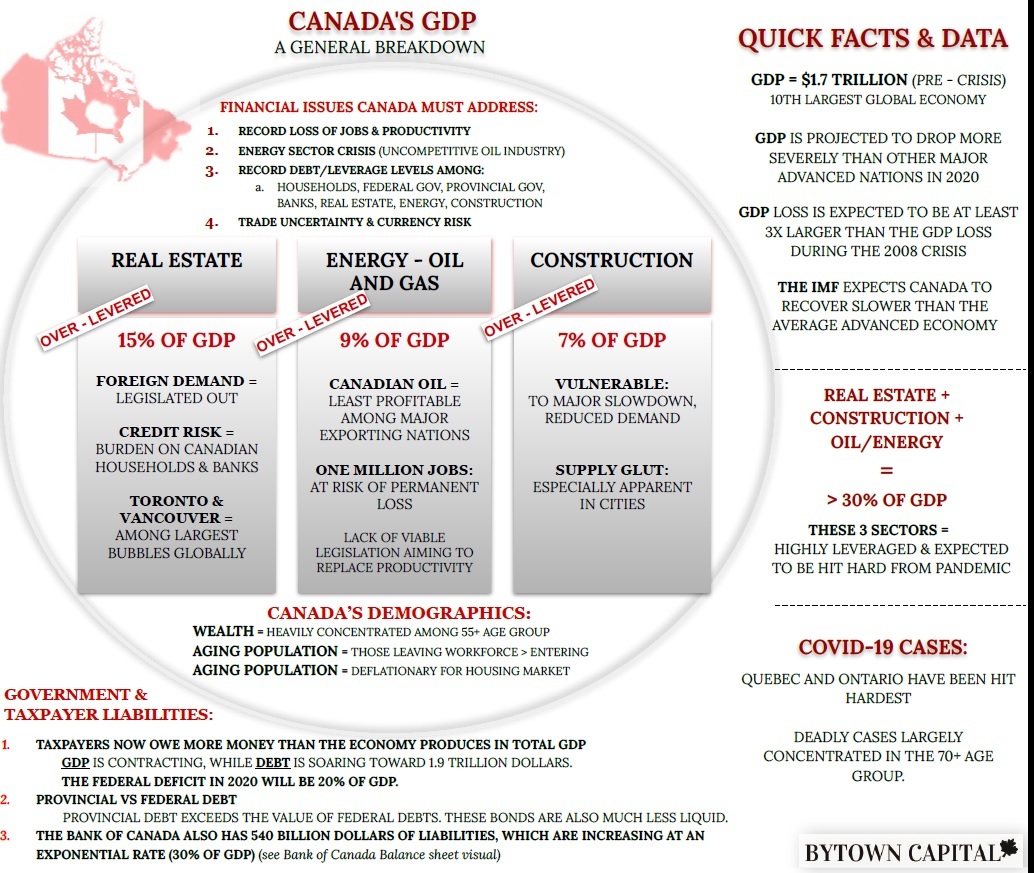
Firstly, notice the composition of Canada's GDP. The oil-reliant nation will be facing a tough road ahead, as the three largest components of economic output are to be impacted in the future by the pandemic. Canada's oil industry has been lagging its competitors for years. Long before anyone heard of a virus called Covid-19, Canadian crude was selling at a fraction of the price compared to WTI. This is due to the fact that the cost of shipping Canadian oil to refineries makes it much less economically viable than say, Saudi or Russian oil. With little hope for a pipeline linking Alberta's tar sands to the Southern United States, Canada's policy makers will need to get created if they hope to replace the loss in productivity which is surely going to drag on the energy sector as the globe recovers from the deep recession of 2020.
Second, we can say with confidence that given Canada's GDP composition, the nation's economy will rebound much slower than other G-20 powers. This statement is hard to argue, given that on top of Canada's oil woes they also have one of the most levered financial systems. In the chart below "Canada's GDP composition," we can see that real estate and construction also account for a huge portion of Canada's GDP. Compared to the United States, Canada is approximately twice as reliant on construction for jobs and much more reliant on real estate as an economic growth driver.
We expect the negative ripple effects from Canada's faltering oil and gas sector to be compounded by the overdependence on real estate and construction in the economy. Together, the factors outlined in chart #1 will certainly pose a significant problem for Canada's banks, which happen to be very heavily exposed to credit losses in these "big three" industries in Canada.
Without going into too much detail, Canada is likely to also experience a drag on its economic recovery due to the fact that its households are more indebted than ever before - with one of the most highly leveraged households in the G-20. If taxes were to rise in response to huge fiscal spending bills, Canadians could be facing years of financial hardships.
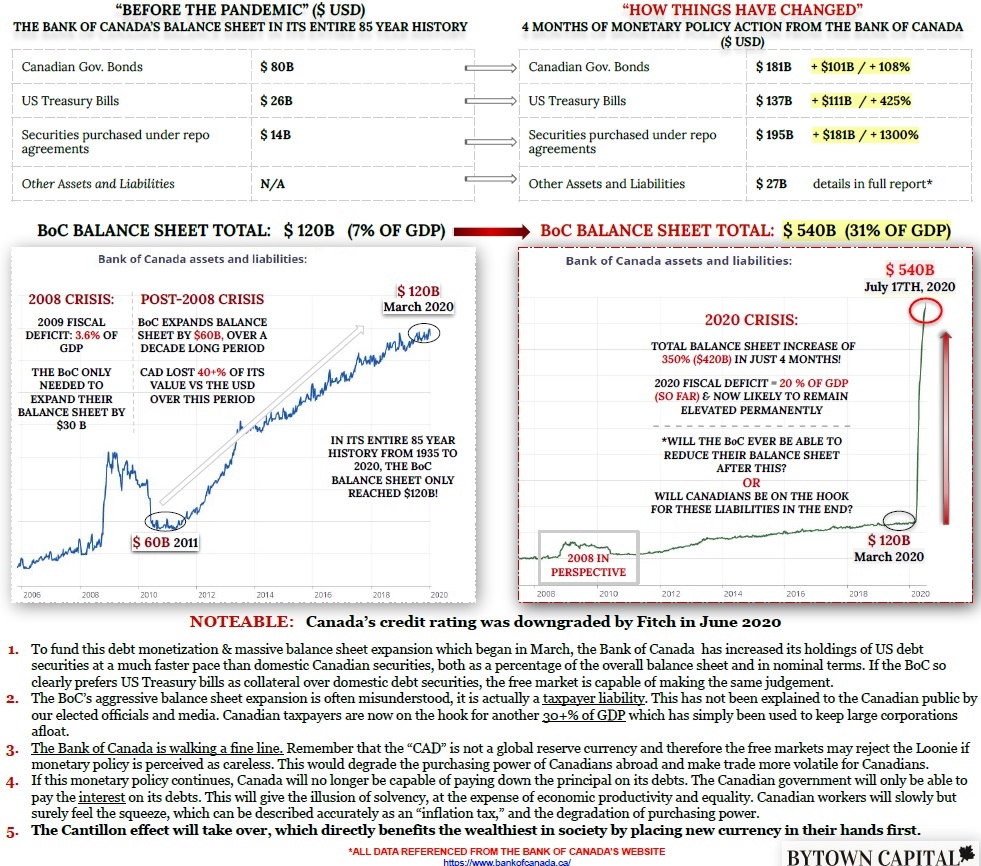
Third, and perhaps most importantly: the Bank of Canada's balance sheet
Chart #2 largely speaks for itself, with a shocking amount of central bank stimulus being needed to prop up the Canadian economy. As a percentage of GDP, the BoC's balance sheet has ballooned to over 30%, compared to just 7% pre-pandemic. Add to the staggering BoC balance sheet expansion the fact that Canada's fiscal deficit will be at least 20% of GDP this year, and we need not go into further detail to understand why there may be some serious implications for the Canadian dollar in the coming months and years.
Conclusions
What do these charts mean for the CAD?!
For a Canadian citizen like myself, there is certainly more than enough reason to be worried. The "Loonie" is at risk of increased volatility at the very least, and a serious lack of foreign demand due to a depleted oil and gas sector. The Bank of Canada has increased its balance sheet at the fastest pace since the pandemic began in comparison to the most liquid global fiat currencies.
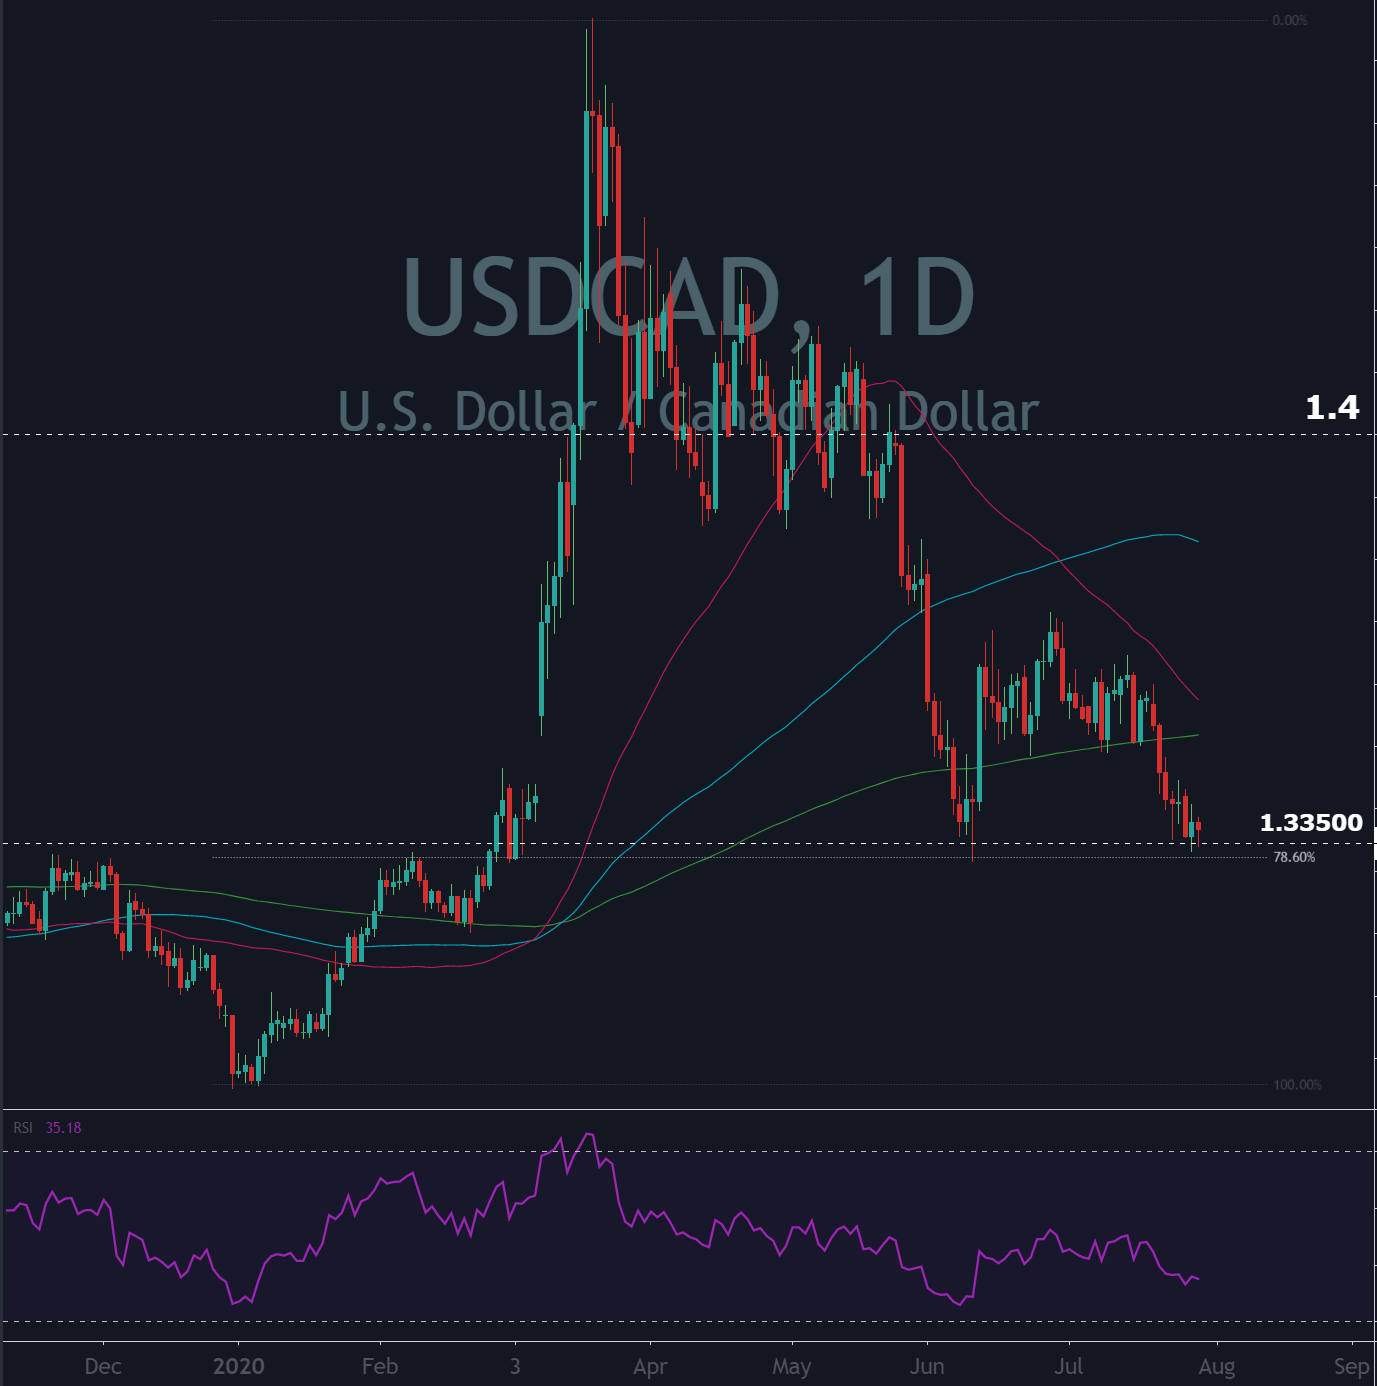
It will certainly be worth paying close attention to Canadian Parliament's fiscal actions in the coming months and years. There are likely to be opportunities to short the CAD against currency's who's central banks have not debased as aggressively. Moreover, Canadian businesses and citizens are likely to be faced with the threat of decreased purchasing power abroad. For reference, here is a chart of the USDCAD exchange rate, where we can see the current zone will be a key juncture to set the direction for price action in the short to medium term.
Oh, and one more thing: the Bank of Canada also sold off all of its gold reserves in 2015!!! Yes, Canada has zero gold saved for a rainy day...
Author

Miles Ruttan
Bytown Capital
Miles' focus at the firm is to oversee our macro analysis, with the emphasis being placed on global credit and liquidity flows.


