GBPUSD: 1.4200 ahead of more substantial support at 1.4160

GBPUSD: 1.4237
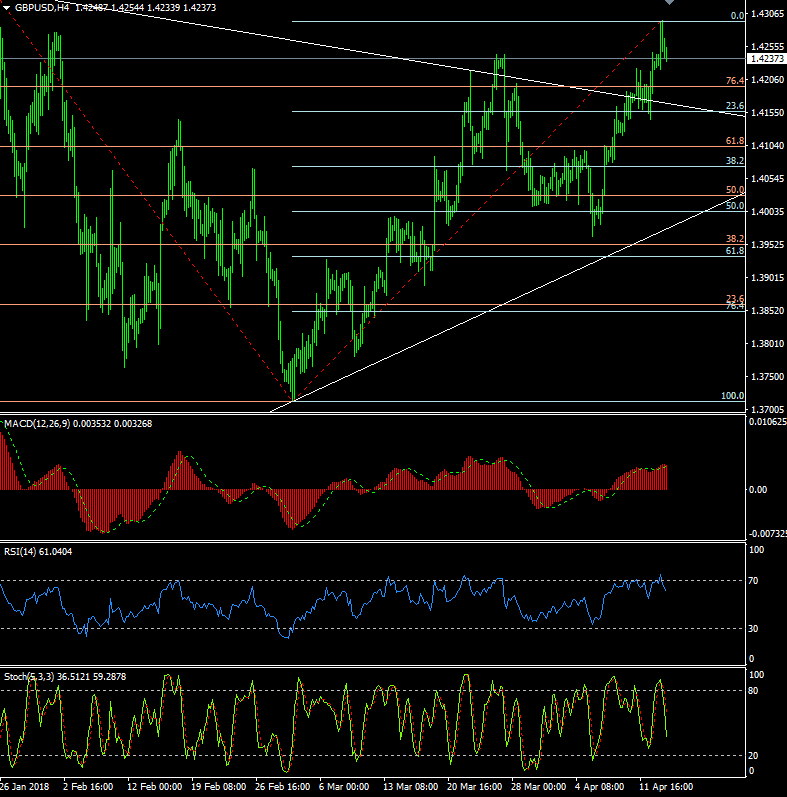
Cable traded higher again on Friday in reaching 1.4295, but then stalled and turned lower to finish the week right on the 200 WMA which could act as a bit of a magnate early in the coming week.
1 hour/4 hour indicators: Mixed
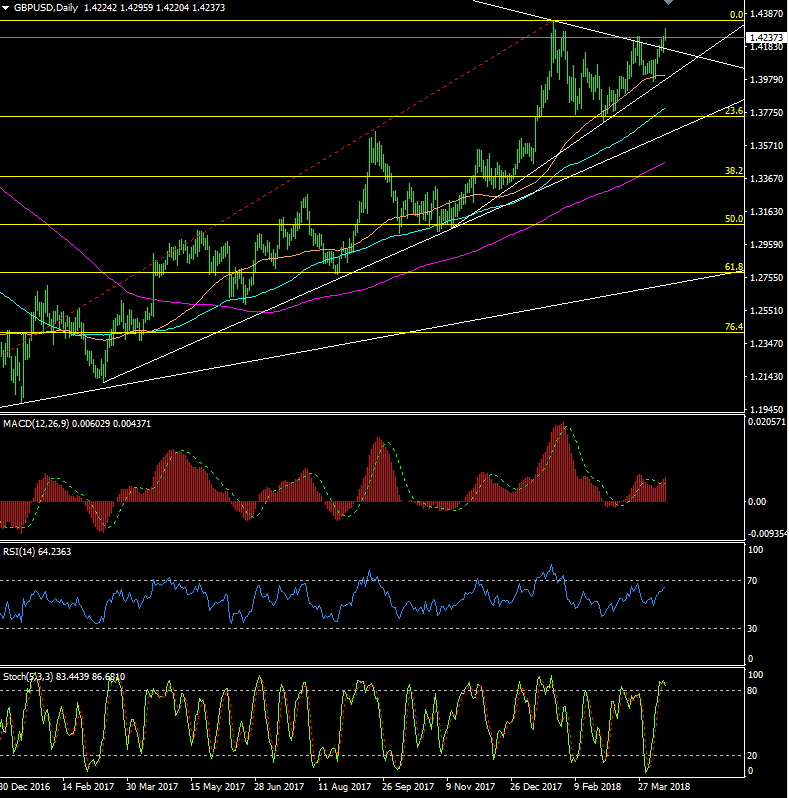
Daily Indicators: Turning higher
Weekly Indicators: Turning Neutral
Preferred Strategy: Although Cable failed at the highs on Friday, the dailies do look positive and if q.4300 can be taken out then we are left looking at a test of the Jan (2018) high 1.4346, above which there is then little to stop a run at the post-Brexit high 1.5022
In the meantime, the short term charts now look a little heavy and hint at a possible return to minor levels at 1.4220 and at 1.4200 ahead of more substantial support at 1.4160.
Overall, while I mildly prefer the topside in the days ahead – given the outlook on the daily charts – I suspect some choppy trade today may see a dip to the downside, and would look to buy Sterling sub 1.4200 for an eventual test of 1.4300, and above.
An interesting point from Bank of Tokyo-Mitsubishi UFJ who say that Cable has risen every April for the past 13 years by an average 2.3%. It is currently up 1.7%.
Economic data highlights will include:
M:
T: UK Unemployment
W: UK CPI, PPI, RPI
T: UK Retail Sales
F:
Author

Jim Langlands
FX Charts
Jim Langlands began his trading career in the commodities markets in London in 1976, before moving to Australia in 1979 to work as a floor trader on the Sydney Futures Exchange.


