GBP/USD Weekly Outlook: Pound Sterling bulls eye break above 1.3600 amid data-driven week
- The Pound Sterling briefly retested offers above 1.3600 against the US Dollar.
- GBP/USD looks to the US CPI inflation and UK GDP data for a boost to head north.
- The daily chart validates a Bull Pennant, with RSI still well above the midline.

The Pound Sterling (GBP) crawled higher against the US Dollar (USD) as the GBP/USD pair hit the highest level since February 2022, briefly above the 1.3600 mark.
Pound Sterling stood defiant against USD tepid recovery
GBP/USD entered a phase of upside consolidation in the first half of the week, following the previous week’s advance to 39-month highs of 1.3593.
The major capitalized on broad-based US Dollar weakness at the start of the week amid renewed fears over the US economy and trade policy uncertainty.
US President Donald Trump announced on Friday that he would double import tariffs on steel and aluminium to 50% in a bid to “even further secure the steel industry in the United States (US)”.
Further, trade concerns intensified after Trump and China accused each other of violating their agreement to mutually roll back tariffs. Moreover, Reuters reported on Monday that the Trump administration is reportedly working on delivering a final trade deal deadline set for this Wednesday.
However, USD buyers jumped back on Tuesday following the release of the stronger-than-expected JOLTS Job Openings, which are closely watched by the Fed. The number of job openings on the last business day of April stood at 7.39 million, following 7.2 million openings recorded in March. The market expectation was for 7.1 million.
This triggered a renewed round of selling in the GBP/USD pair, having faced rejection above 1.3550 for the second day in a row on Tuesday.
However, buying interest around the pair started rebuilding midweek as the Greenback felt the heat of the disappointing US data, which raised economic concerns and revived dovish US Federal Reserve (Fed) expectations.
Data published by ADP showed on Wednesday that the US private sector payrolls increased just 37,000 for the month, below the downwardly revised 60,000 in April and the forecast for 115,000.
The US May ISM Services PMI unexpectedly contracted to 49.9, following April’s 51.6 and 52 expected.
Attention then turned toward Friday’s all-important US Nonfarm Payrolls data for May. And, hence, traders resorted to covering up their USD short positions, allowing the buck to recover some ground.
Renewed US-China trade optimism also aided the Greenback’s recovery attempts. Trump said on Truth Social on Thursday that he had a "very good phone call" with Chinese President Xi Jinping, during which they discussed the intricacies of the trade deal.
On Friday, the data published by the US Bureau of Labor Statistics (BLS) showed that Nonfarm Payrolls (NFP) rose by 139,000 in May, beating the market expectation of 130,000. Other details of the employment report showed that the Unemployment Rate held steady at 4.2%, as forecast. With these figures supporting the USD, GBP/USD edged lower but managed to hold above 1.3500.
The focus stays on US CPI, UK GDP and trade talks
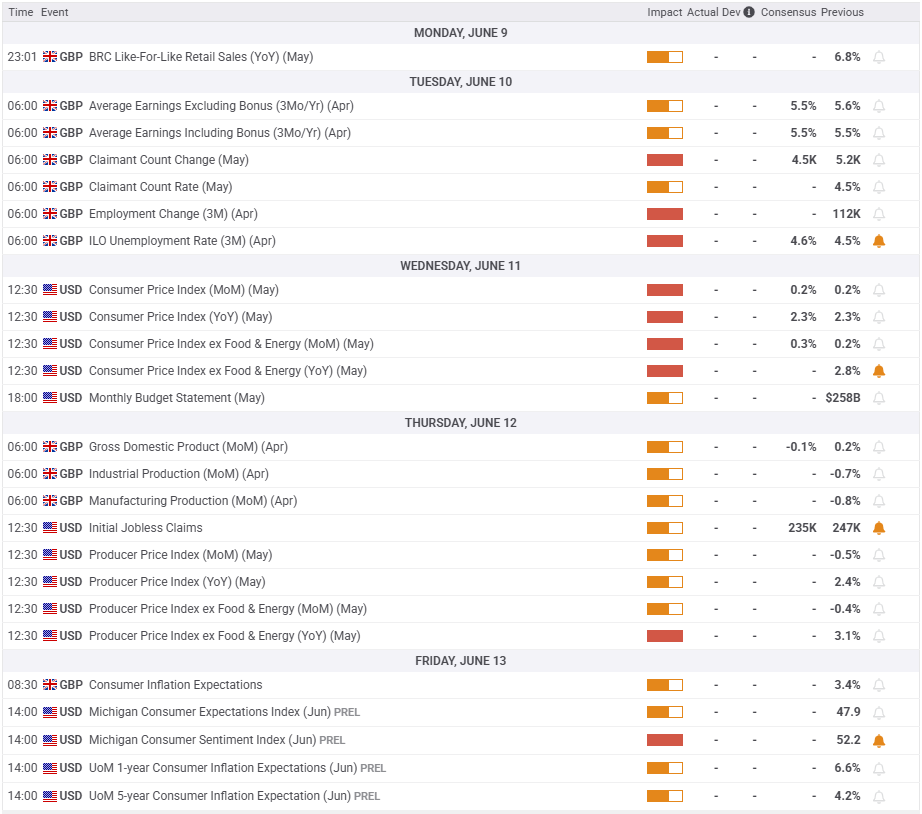
Traders brace for a quiet start to a big week, packed with critical economic data from both sides of the Atlantic.
Monday will feature China’s Consumer Price Index (CPI) and Producer Price Index (PPI) data, which will significantly impact the market’s appetite for risk assets as the dragon nation remains in a disinflationary trend.
The focus will then shift toward the labor market report from the United Kingdom (UK) on Tuesday, the only relevant macro data for Pound Sterling traders.
The next of note will be Wednesday’s US CPI inflation data for May, which will help markets reprice Fed rate cut expectations for the rest of this year. This could trigger a fresh direction in the USD and, in turn, in the GBP/USD pair.
The UK monthly Gross Domestic Product (GDP) and Industrial Production data will be published on Thursday, followed by the US PPI inflation data later in American trading. The weekly US Jobless Claims data will be on traders’ radars.
On Friday, the US and the UK inflation expectations data will be reported to wrap up an eventful week.
Besides data publication, trade headlines and geopolitical developments surrounding the Russia-Ukraine conflict will continue to play a pivotal role in the GBP/USD price action.
The Fed enters its ‘blackout period’ this Saturday ahead of the June 17-18 monetary policy meeting.
GBP/USD: Technical Outlook
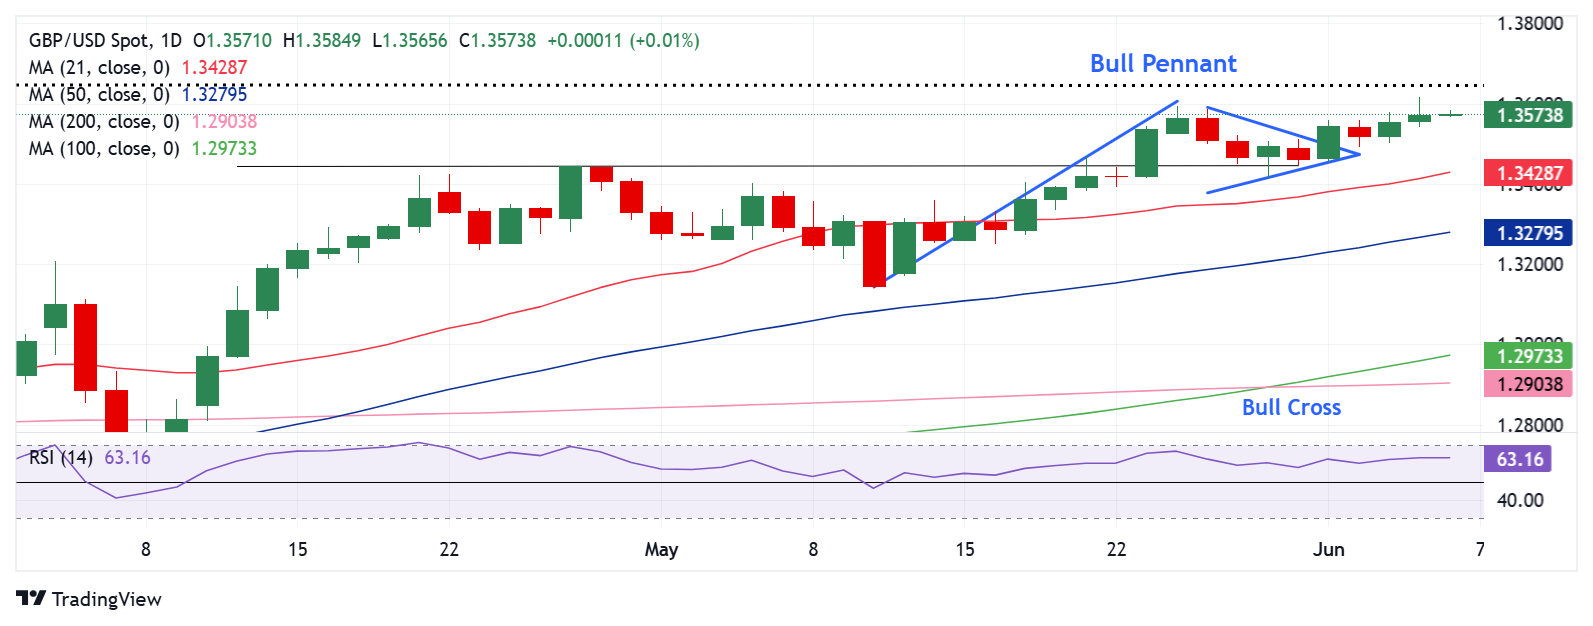
The daily chart shows that GBP/USD has validated a Bull Pennant on a daily close above the falling trendline support at 1.3503 last Monday, indicating the continuation of the ongoing uptrend.
The 100-day Simple Moving Average (SMA) and the 200-day SMA bullish crossover, confirmed last week, also remains in play.
Adding credence to the constructive outlook, the 14-day Relative Strength Index (RSI) holds firm above the midline, currently near 63.
The pair must scale the 1.3600 level on a sustained basis to extend its upward trajectory toward the February 2022 high at 1.3643 and the $1.3700 round figure.
Further up, the January 2022 high at 1.3749 will challenge bearish commitments.
Conversely, rejection once again above the 1.3600 barrier could fuel a fresh correction toward the April 28 high of 1.3445.
The next healthy support level is spotted at the May 13 low of 1.3270, where the 50-day SMA coincides.
Inflation FAQs
Inflation measures the rise in the price of a representative basket of goods and services. Headline inflation is usually expressed as a percentage change on a month-on-month (MoM) and year-on-year (YoY) basis. Core inflation excludes more volatile elements such as food and fuel which can fluctuate because of geopolitical and seasonal factors. Core inflation is the figure economists focus on and is the level targeted by central banks, which are mandated to keep inflation at a manageable level, usually around 2%.
The Consumer Price Index (CPI) measures the change in prices of a basket of goods and services over a period of time. It is usually expressed as a percentage change on a month-on-month (MoM) and year-on-year (YoY) basis. Core CPI is the figure targeted by central banks as it excludes volatile food and fuel inputs. When Core CPI rises above 2% it usually results in higher interest rates and vice versa when it falls below 2%. Since higher interest rates are positive for a currency, higher inflation usually results in a stronger currency. The opposite is true when inflation falls.
Although it may seem counter-intuitive, high inflation in a country pushes up the value of its currency and vice versa for lower inflation. This is because the central bank will normally raise interest rates to combat the higher inflation, which attract more global capital inflows from investors looking for a lucrative place to park their money.
Formerly, Gold was the asset investors turned to in times of high inflation because it preserved its value, and whilst investors will often still buy Gold for its safe-haven properties in times of extreme market turmoil, this is not the case most of the time. This is because when inflation is high, central banks will put up interest rates to combat it. Higher interest rates are negative for Gold because they increase the opportunity-cost of holding Gold vis-a-vis an interest-bearing asset or placing the money in a cash deposit account. On the flipside, lower inflation tends to be positive for Gold as it brings interest rates down, making the bright metal a more viable investment alternative.
Author

Dhwani Mehta
FXStreet
Residing in Mumbai (India), Dhwani is a Senior Analyst and Manager of the Asian session at FXStreet. She has over 10 years of experience in analyzing and covering the global financial markets, with specialization in Forex and commodities markets.