GBP/USD weakens rapidly amid dovish data and external pressures

The GBP/USD pair fell sharply to 1.3048 on Thursday, pressured by a combination of soft domestic inflation data and a broadly stronger US dollar.
The pound's decline was triggered by the latest UK Consumer Price Index (CPI) report, which showed inflation slowed to 3.6% year-on-year in October, matching forecasts. This bolstered market expectations that the Bank of England (BoE) could initiate interest rate cuts as early as December. The data fits a broader narrative of weakening domestic demand: the labour market is cooling, GDP growth is undershooting the central bank's projections, and core inflation is tracking slightly below the BoE's anticipated path. In light of this, institutions, including Deutsche Bank, suggest the Monetary Policy Committee (MPC) will gain the confidence needed to lower the Bank Rate from its current 4.00% level.
Additional headwinds for sterling stemmed from a resurgent US dollar, which found support ahead of key US macroeconomic data and the highly anticipated earnings report from the AI-chip giant, Nvidia.
Globally, investor attention is also captivated by the Japanese yen, which slumped to a 10-month low after the Ministry of Finance issued a statement expressing a "high degree of caution" over the currency's movements. This phrase stopped short of threatening direct intervention.
Overall, market uncertainty is elevated. US statistical agencies are only just beginning to release the backlog of data delayed by the recent government shutdown, leaving traders to piece together the true state of the world's largest economy.
Technical analysis: GBP/USD
Four-hour chart
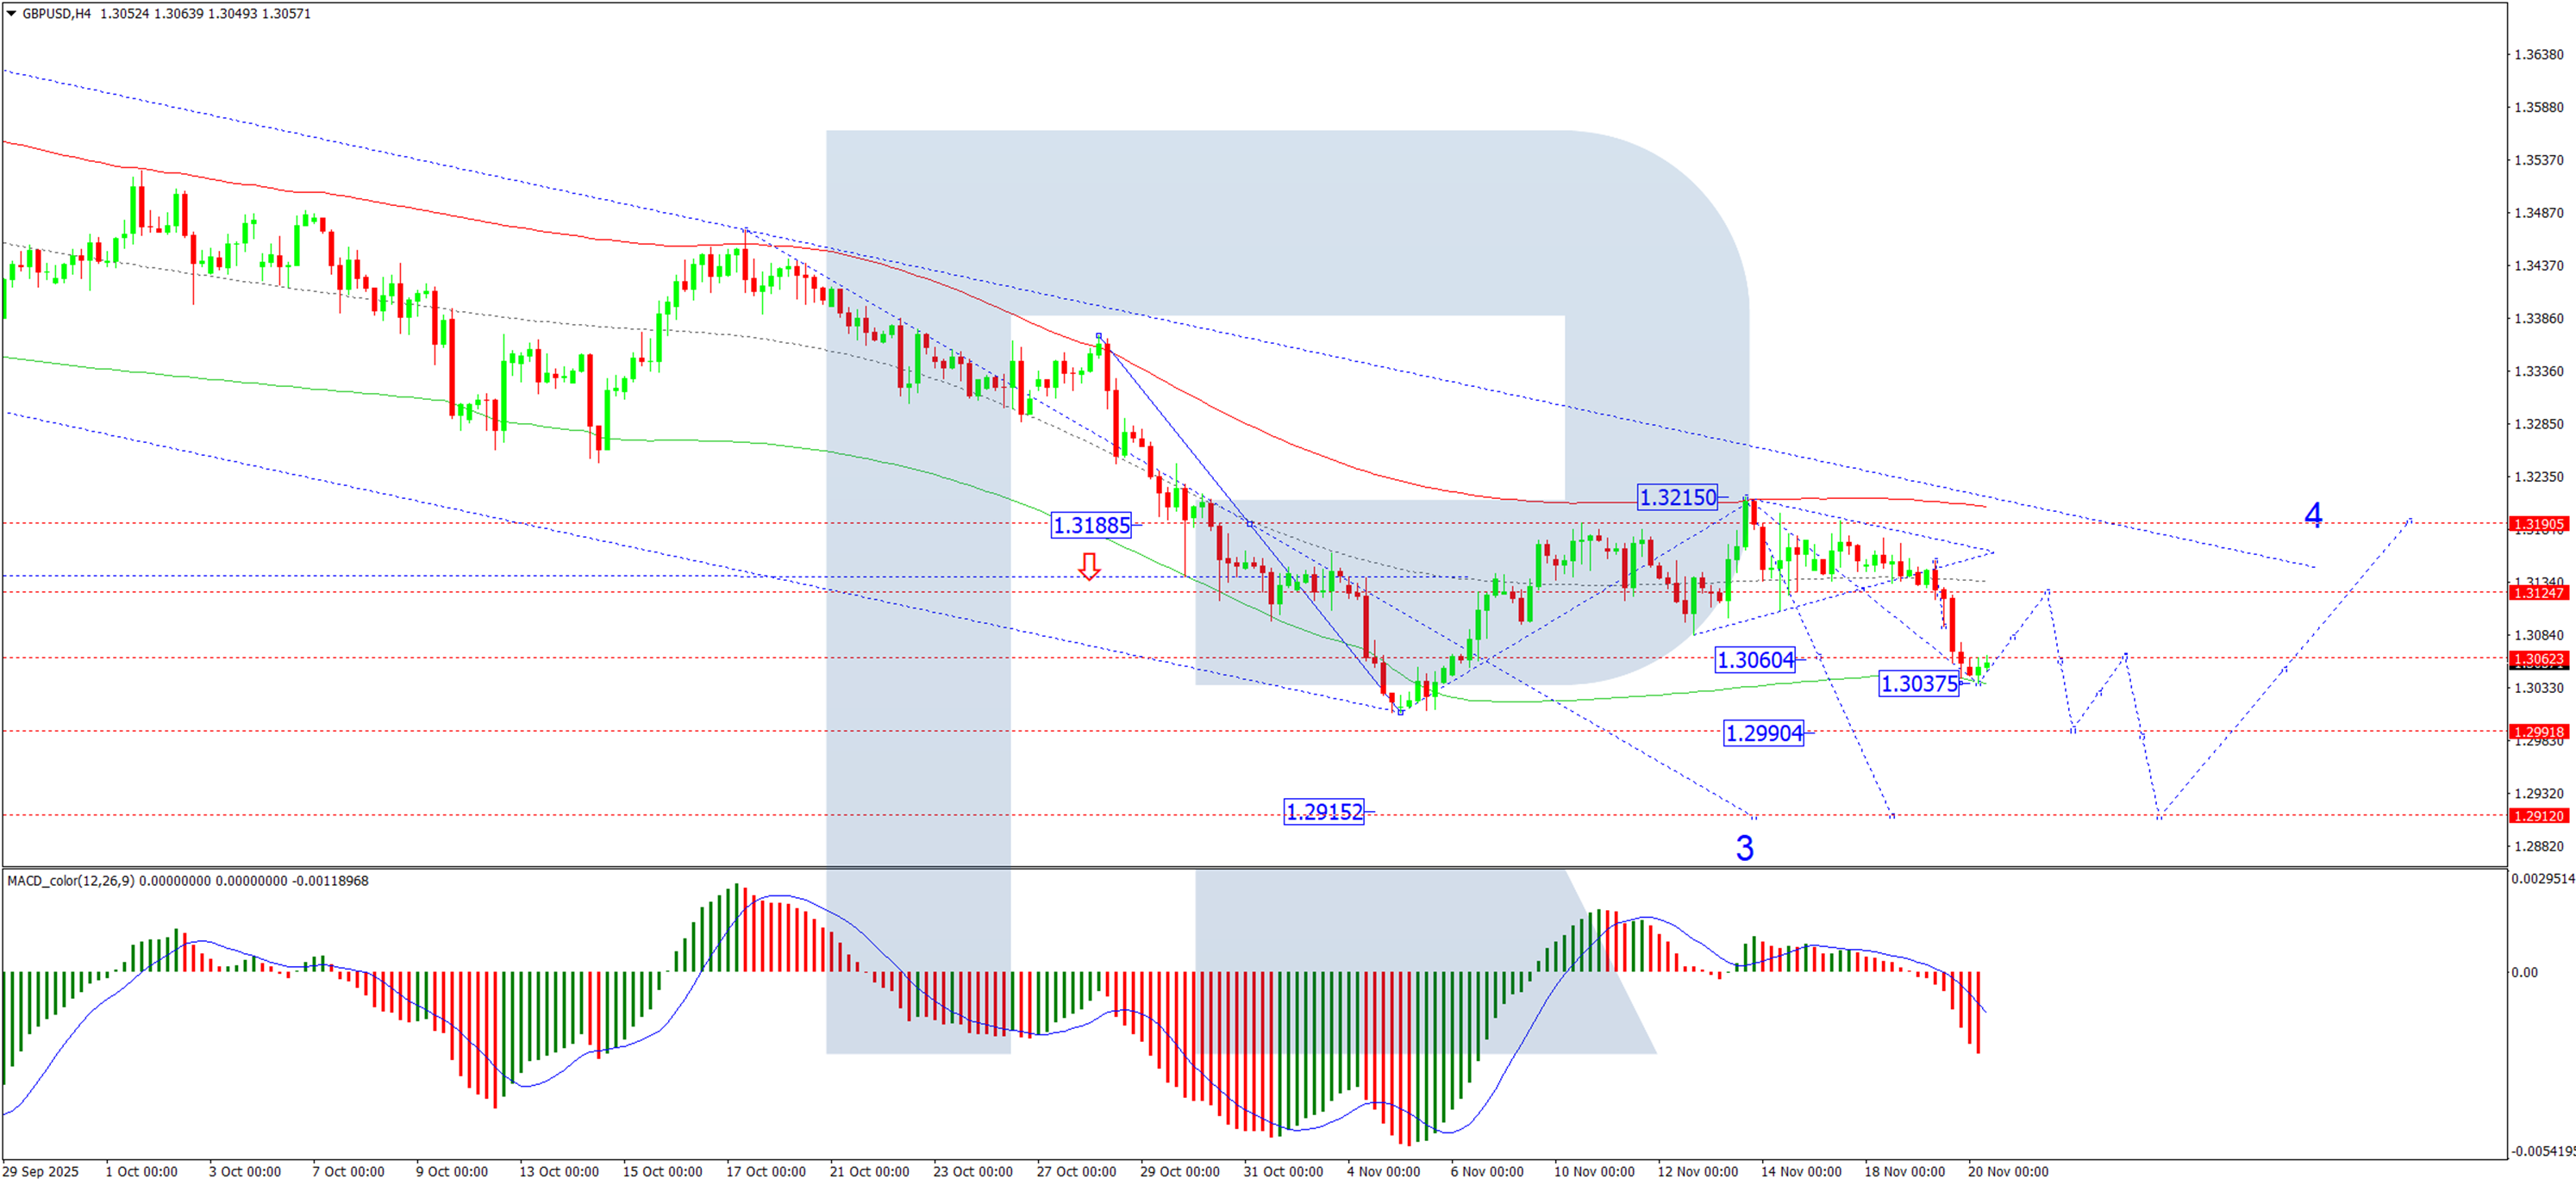
On the H4 chart, GBP/USD has completed a downward wave to 1.3037. We now anticipate a technical correction towards at least 1.3080. Following this pullback, the primary downtrend is expected to resume, driving the pair towards 1.2990, with a longer-term prospect of extending losses to 1.2915. This bearish scenario is confirmed by the MACD indicator. Its signal line is located below zero and pointing decisively downward, indicating that selling momentum remains firmly intact.
One-hour chart
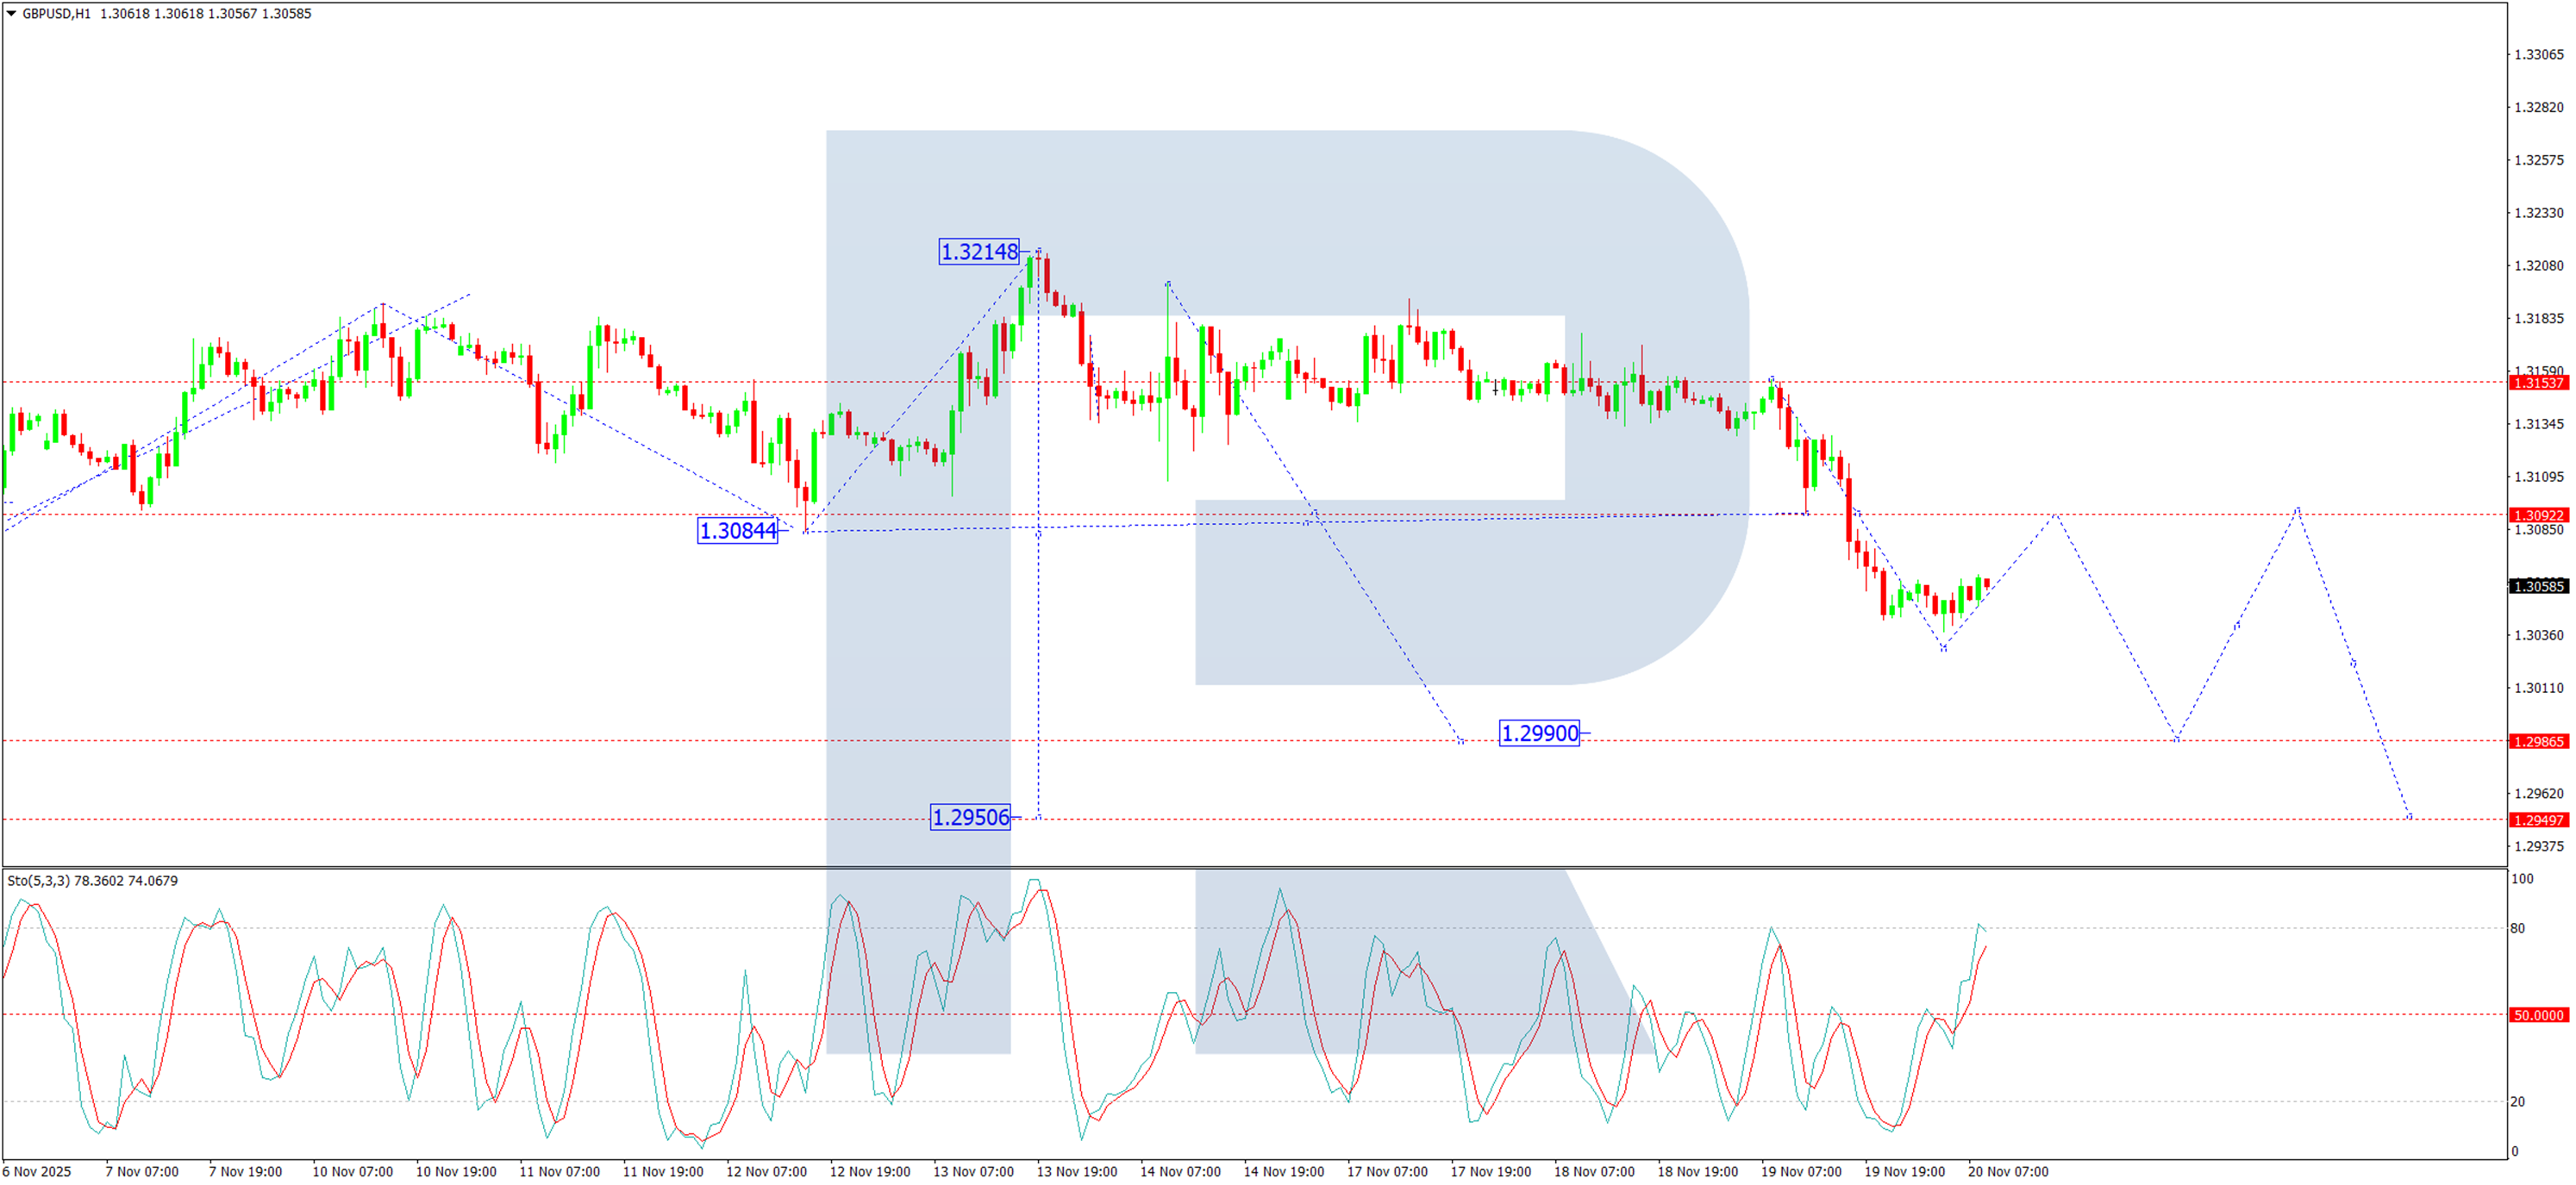
On the H1 chart, the pair broke downwards from a consolidation range around 1.3090, confirming the continuation of the bearish impulse. The immediate target for this leg is 1.3030. A corrective bounce to retest the 1.3090 level from below is likely before the next wave of selling takes the pair down to 1.2990 and potentially towards 1.2950. The Stochastic oscillator aligns with this view. Its signal line is above 50, indicating that a short-lived corrective bounce is underway before the dominant downtrend reasserts itself.
Conclusion
The GBP/USD is facing a perfect storm of domestic dovish shifts and external dollar strength. The softer inflation print has significantly increased the odds of a December BoE rate cut, eroding sterling's yield appeal. Technically, the path of least resistance remains firmly to the downside. While a short-term correction towards 1.3080 is likely, this should be viewed as a potential selling opportunity within the broader bearish trend, which has clear targets at 1.2990 and 1.2915.
Author

RoboForex Analysis Department
RoboForex
RoboForex Analysis Department provides timely market insights, expert technical analysis, and actionable forecasts across forex, commodities, indices, and equities.