|

GBP/USD roller coaster part of wave 4 pullback in uptrend

  • GBP/USD is creating an increased price volatility between 1.3205 support and 1.35 resistance zones. That said, price action remains in a solid uptrend

  • What is next for the Cable? How can the Elliott Wave and chart patterns help our analysis? Let’s review them all.

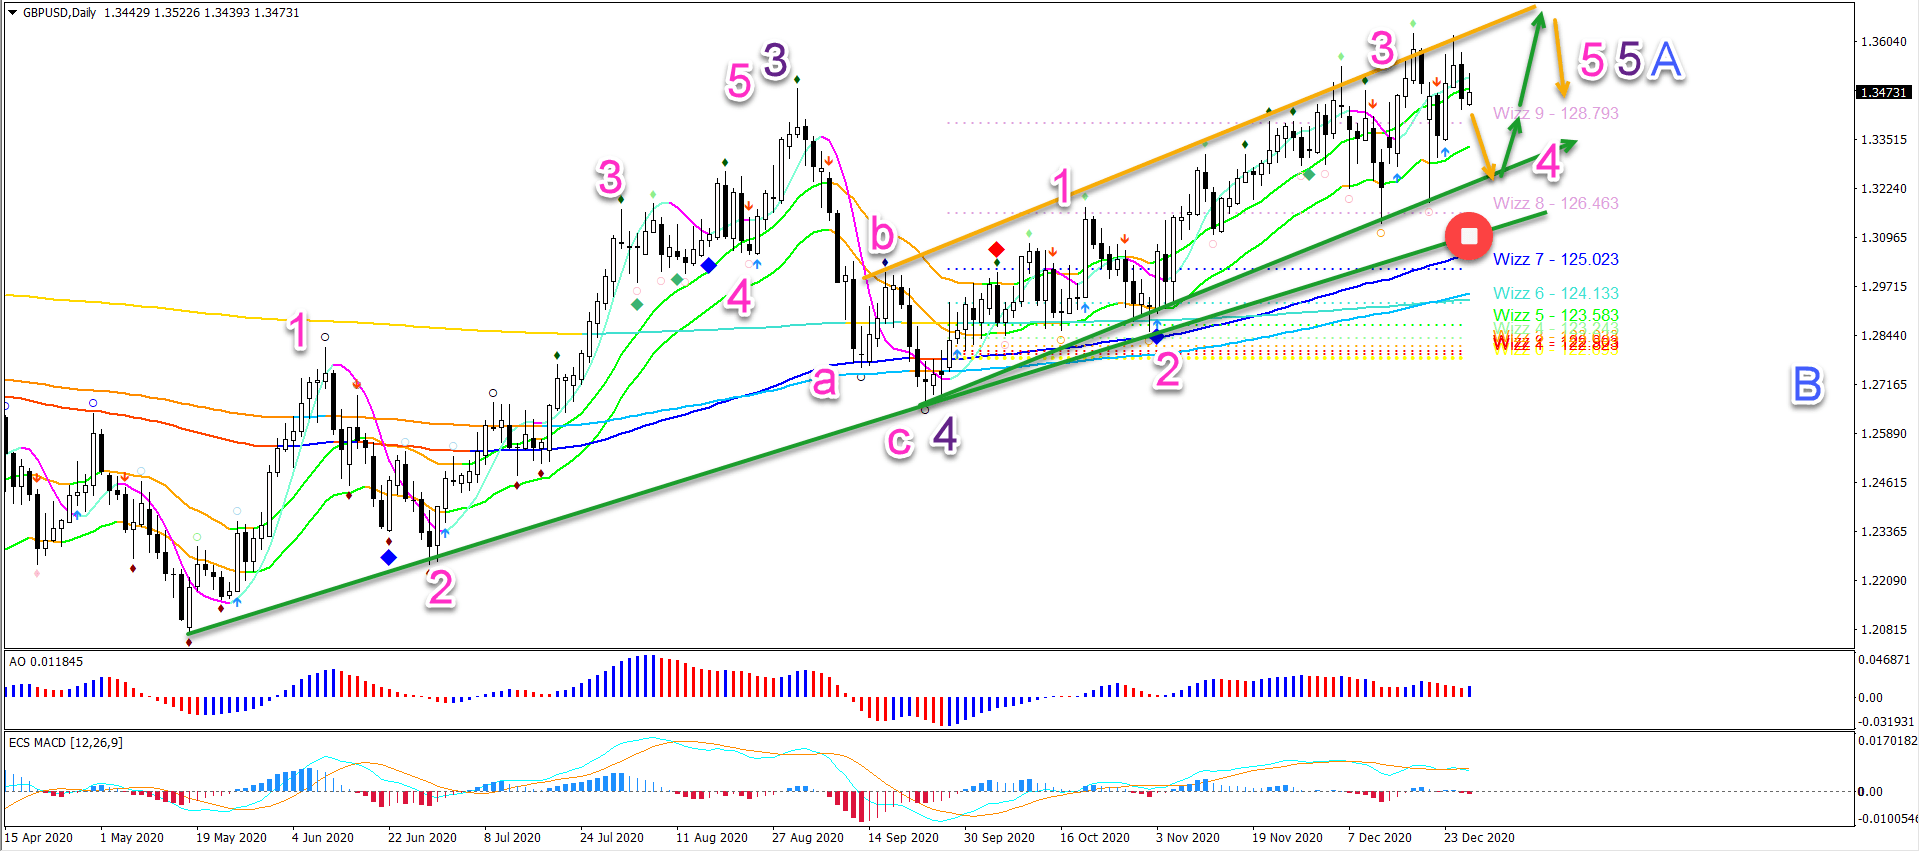
  • The main question is whether the smaller wave 5 (pink) has already been completed. And for the moment, the answer seems to be no.

The GBP/USD is creating an increased price volatility between 1.3205 support and 1.35 resistance zones. That said, price action remains in a solid uptrend when comparing the moving averages (21 ema above 144 ema above 610).

GBPUSD

Price Charts and Technical Analysis

The GBP/USD is building a bullish 5 wave pattern (purple) after a long-term downtrend. The wave 5 could complete a larger wave A (blue) of an ABC (blue).

Because the recent ups and downs are probably part of a wave 4 (pink) retracement. This remains valid as long as price action respects the support zone of the uptrend channel (green).

A break below the support invalidates (red circle) this wave outlook and indicates a deeper bearish retracement. A bullish bounce, however, could indicate one more push up towards the top of the channel around 1.37.

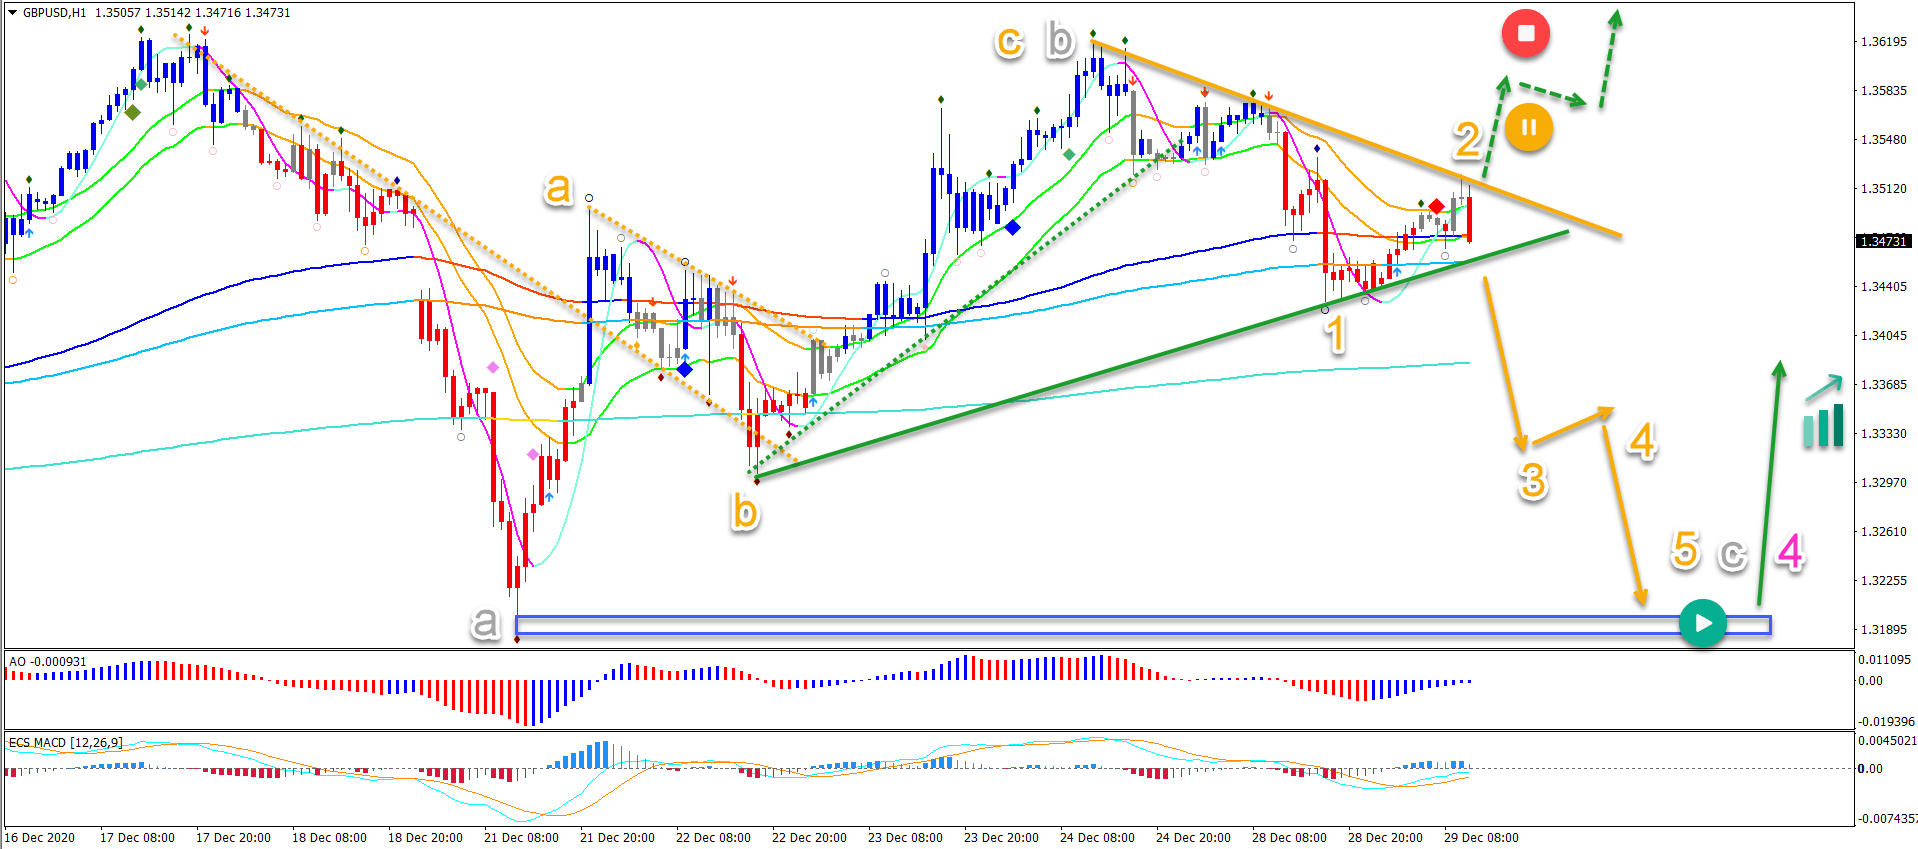
On the 1 hour chart, it is possible to monitor the development of the potential wave 4 (pink). The upside looks like an ABC (orange) that completes wave B (grey). 

A bearish breakout could confirm the wave C (grey). The main target zone is the previous bottom (blue box). 

A bullish breakout followed by a bull flag and another break upwards would invalidate (red circle) the expected bearish wave C.

GBPUSD

The analysis has been done with the ecs.SWAT method and ebook.

Author

Chris Svorcik

Chris Svorcik

FS method

Chris Svorcik is a trader, analyst, and educator with over 15 years of experience in financial markets, specializing in moving averages, market structure, and price patterns.

More from Chris Svorcik
Share:

Editor's Picks

AUD/USD falls to near 0.7100 after slipping below 50-day EMA

AUD/USD depreciates after registering minor gains in the previous day, trading around 0.7120 during the Asian hours. The technical analysis of the daily chart shows the pair consolidating sideways within a rectangle pattern, as neither bulls nor bears gain control. The AUD/USD pair is holding a slight bearish tone however as it sits beneath both the nine-day and 50-day EMAs.

Japanese Yen edges up but remains close to the 160.00 intervention threshold

The Japanese Yen edges up against the US Dollar on Friday, but the USD/JPY pair remains above 159.90 at the time of writing, unable to put a significant distance from the 160.00 level, considered the limit of tolerable JPY weakness for Japanese authorities.

Gold returns to the red, awaits US NFP

Gold price is looking to test the weekly lows, while in the red near $4,450 in the early European session on Friday. The precious metal remains vulnerable amid ongoing geopolitical turmoil. Traders will closely monitor the developments surrounding the US-Iran peace deal and the US May employment report later on Friday.


Arthur Hayes' “Holy Trinity” is dead: Exits Zcash after Orchard Pool exploit

Arthur Hayes has entirely dumped his “Holy Trinity” holdings by offloading his Zcash holdings on Friday. The privacy coin is down 13% so far on Friday, extending Thursday’s 26% decline after an Orchard Shielded Pool audit revealed a critical vulnerability that allowed the undetectable minting of fake coins. Hayes continues to hold Worldcoin ahead of the upcoming SpaceX Initial Public Offering, on the chance of a “high-beta proxy” rally.

Nonfarm Payrolls set to show stable labor market in May as markets digest Fed hawkish shift

The United States Bureau of Labor Statistics will release the Nonfarm Payrolls data for May on Friday at 12:30 GMT. Investors expect NFP to rise by 85K following the surprisingly strong 185K and 115K increases recorded in March and April, respectively.

The US economy defies the rules: 100 days into the Oil shock and the recession signal is still missing

More than three months after the start of the Iran war and the resulting disruption to global energy markets, the US economy continues to display remarkable resilience. The conflict has triggered a sharp rise in Oil prices, reignited inflationary pressures and fueled widespread concerns about a potential economic slowdown.