GBP/USD reaches highest level since February, 2022
The greenback, commonly referred to as the cable, has reached its highest level against the U.S. dollar since early 2022, trading at the psychologically significant level of 1.36 as of June 2025. This currency pair has been influenced by diverging central bank policies, different economic narratives, and varying inflation rates on both sides of the Atlantic. In detail, the dollar has plunged nearly 10 percent on the back of underwhelming job data in the U.S. paired with speculation of Fed rate cuts on the back of inflation. Conversely, the U.K. has shown solid data with retail sales rising 1.2 percent in April, while inflation rose 3.5 percent year-over-over in April from 2.6 percent. This recent consumer prices report has led the Bank of England to reconsider moves toward rate cuts.
In this report, we will examine the economic situations in the United Kingdom and the United States, analyze their impact on the GBP/USD exchange rate, and provide a detailed technical analysis across multiple time frames.
GBP/USD four hour chart
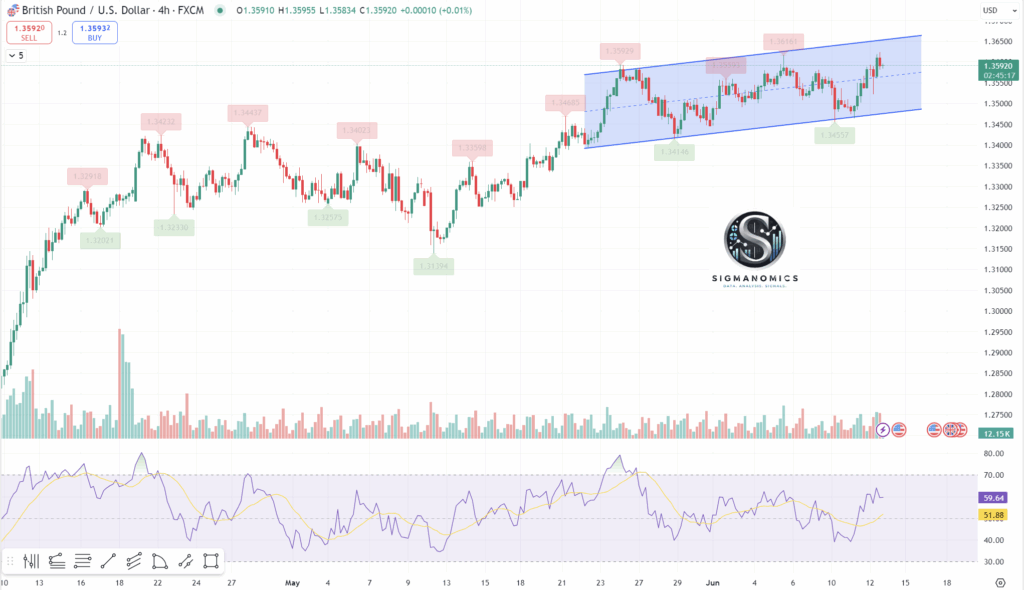
Upon analyzing the 4-hour chart, it is evident that the GBPUSD currency pair has navigated into a defined rising channel, indicating a potential bullish trend. However, the absence of clear Relative Strength Index (RSI) divergence suggests that a breakout could occur in either direction—upward or downward. This uncertainty necessitates that traders exercise caution and closely monitor this congested area for signs of market movement. Key pivot levels that could influence price action are identified at 1.34557 and 1.36161, serving as critical points for decision-making in trading strategies.
GBP/USD daily chart
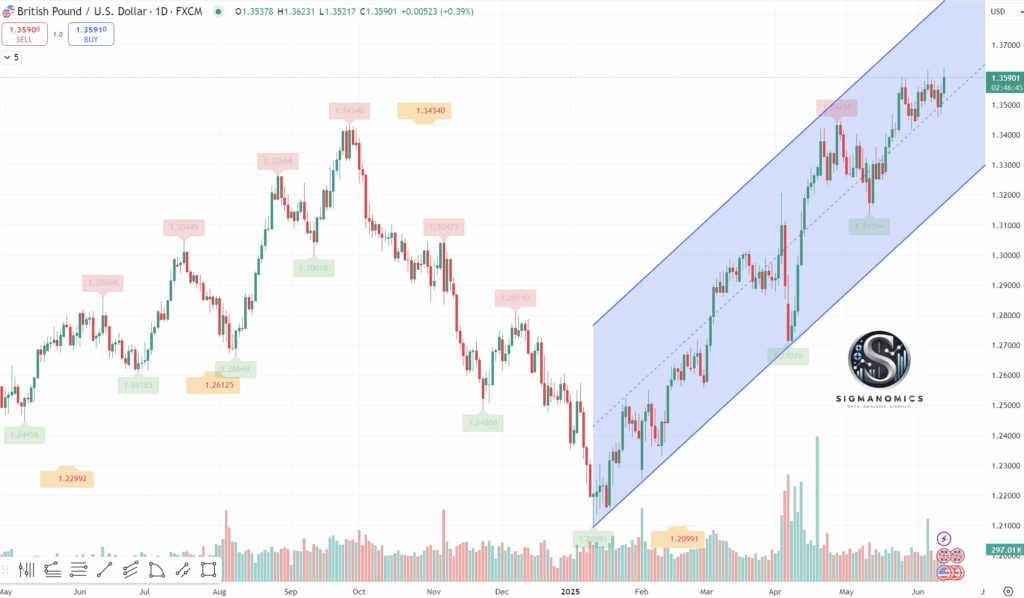
On the daily chart, the British pound is navigating a sharply ascending channel against the US dollar, indicative of strong buying pressure. The critical trendline support aligns with the daily pivot point at 1.3194, serving as a vital threshold for traders. As market participants observe a potential double top pattern forming, bearish traders are poised to capitalize on any breach beneath this significant support level. In contrast, bullish traders remain on the lookout for compelling signs of momentum that would enable a decisive breakout through the overhead resistance, setting the stage for further upward movement.
GBP/USD weekly chart
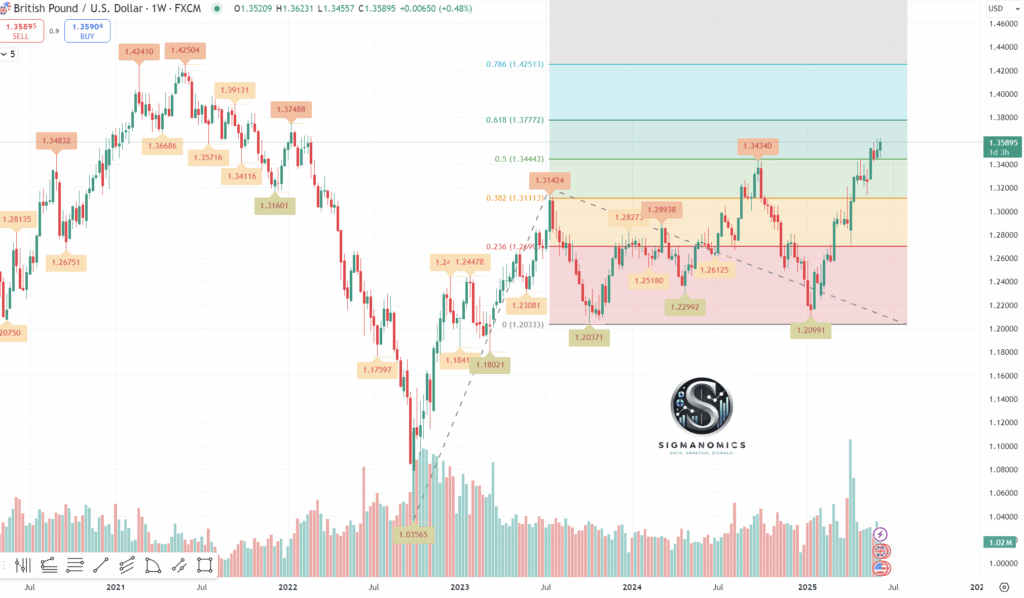
The Weekly chart is of great importance as the pair seems to have slipped above the 50 percent fibonacci extension with bulls looking for follow through to the 61.8 percent extension at 1.38 which also pairs with psychological resistance. Should any pullbacks arise, bears should watch rising trend line support and psychological support at 1.2500.
BBVA and other analysts have recently said, celebrate sterling’s 8 percent gains in 2025, but caution that further upside might be limited without fresh catalysts. Looking ahead, market participants should keep an eye on U.S. policy shifts for possible renewed dollar support. If the Fed resists rate cuts or unexpected safe-haven demand emerges, this could constrain GBP/USD.
Author

Sigmanomics
Sigmanomics
Sigmanomics is a financial intelligence platform that delivers expert insights, data-driven analysis, and real-time trading signals across global markets.


