GBP/USD range reaches decisive moment for bear or bull break
-
GBP/USD is showing a lengthy bearish reversal since the end of February 2021. More recently, price action has bounced at the previous bottom creating a double bottom.
-
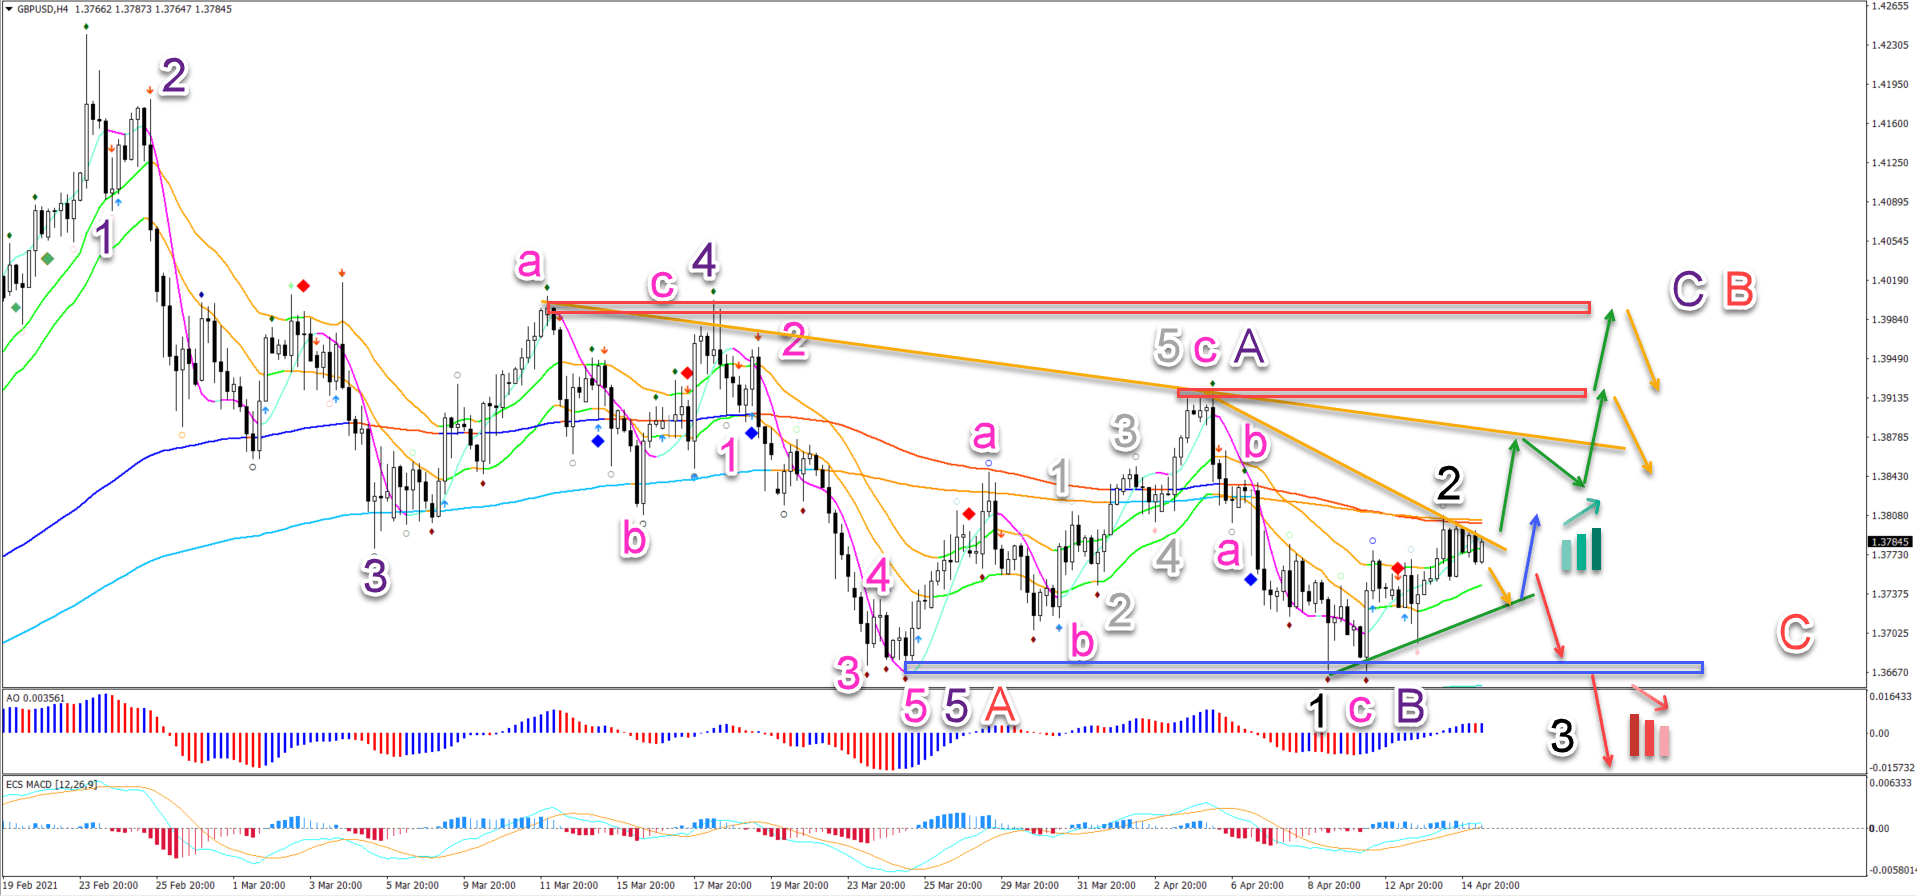
The GBP/USD seems to have completed a bearish 5 wave pattern (purple). This could be part of a larger bearish ABC pattern (red).
-
The bullish break could confirm the wave 3 (green) of 3 (grey) within the larger wave C (pink) of the 4-hour chart.

The GBP/USD is now stuck between support and resistance but a breakout could offer the needed clarification. Let’s review.
Price charts and technical analysis
The GBP/USD seems to have completed a bearish 5 wave pattern (purple). This could be part of a larger bearish ABC pattern (red).
-
Currently price action is probably in a bullish wave C (purple), which could complete the wave B (red) of a larger ABC (red).
-
The double bottom could have completed the wave c (pink) of wave B (purple).
-
A bullish breakout (green arrows) above the resistance trend line (orange) and long-term moving averages would confirm this analysis.
-
The main upside targets are the previous tops (red boxes).
-
A bearish bounce at the resistance (orange arrows) could end the wave B (red) and start the wave C (red),
-
A bearish push could retest the support line (green) and bounce (blue arrow).
-
A bearish breakout below the support (green) could indicate a downtrend (red arrows). In that case, price action could be completing a bearish 123 (black) and the bullish correction is invalidated.
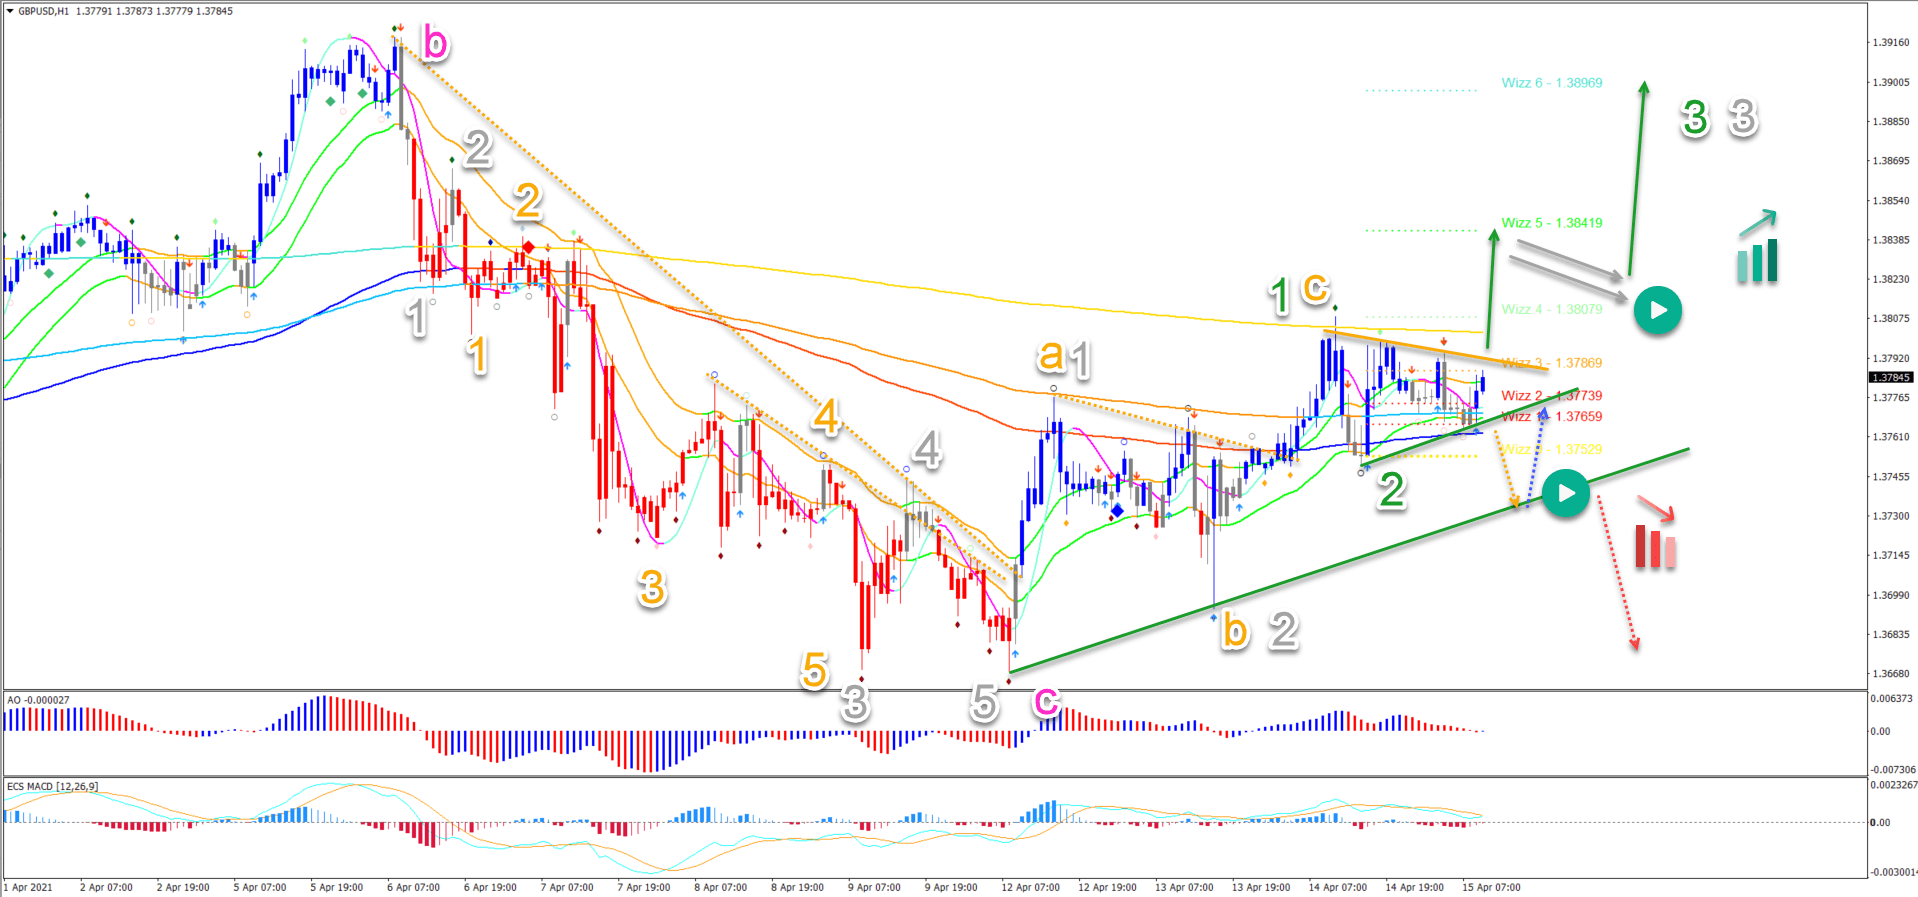
On the 1 hour chart, blue SWAT candles indicate a bullish trend. But a breakout remains key for confirming any upside:
-
A push above wizz 4 level with strong price action could confirm the breakout (green arrows).
-
The bullish break could confirm the wave 3 (green) of 3 (grey) within the larger wave C (pink) of the 4 hour chart.
-
A bearish breakout (red arrow), however, indicates that the upside was not a wave 1-2 but an ABC (orange) pattern.
The analysis has been done with the ecs.SWAT method and ebook.
Author

Chris Svorcik
Elite CurrenSea
Experience Chris Svorcik has co-founded Elite CurrenSea in 2014 together with Nenad Kerkez, aka Tarantula FX. Chris is a technical analyst, wave analyst, trader, writer, educator, webinar speaker, and seminar speaker of the financial markets.


