GBP/USD is capped by massive resistance and has more room to the downside — Confluence Detector


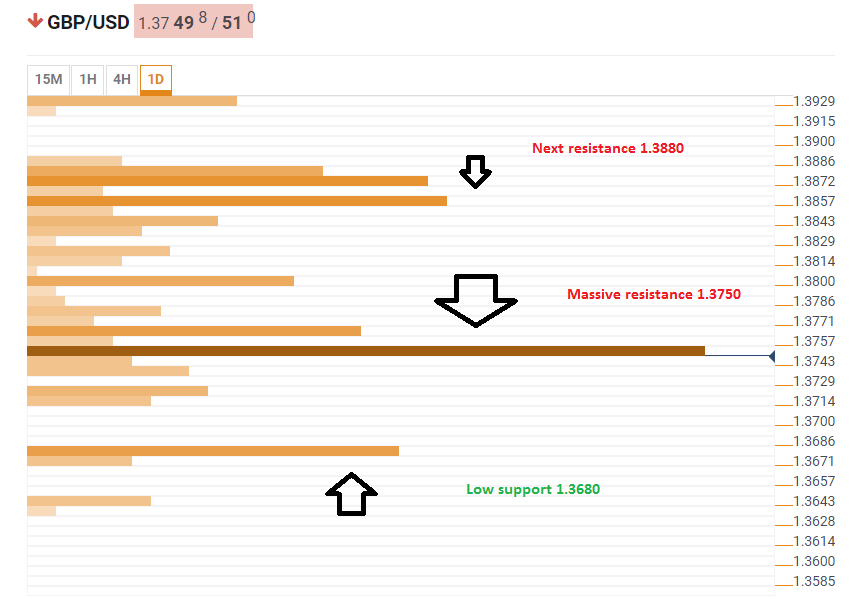
The Technical Confluences Indicator shows that the GBP/USD will find it hard to break above $1.3750 which is a dense congestion of resistance lines: the Fibonacci 38.2% one-day, the Bolinger Band 15m-Lower, the one-month low, the one-week low, the SMA5-15m, the SMA10-15m, the SMA100-15m, and the Bolinger Band 15m-Middle. 

Should the pair break higher, it faces scattered levels of resistance and the most significant convergence of lines is at $1.3880. This is the meeting point of the Fibo 38.2% one-week, the Simple Moving Average 100-1h, the Pivot Point one-day R2, and the Fibo 161.8% one-day.

Looking down, support awaits at $1.3680, which is the confluence of the Pivot Point one-week S1, the Pivot Point one-day S2, and more. 

All in all, the path of least resistance remains to the downside. A failure to break above $1.3750 could lead to a significant downfall.

Here is how it looks on the tool:

GBP USD confluence levels May 1 2018

Confluence Detector

The Confluence Detector finds exciting opportunities using Technical Confluences. The TC is a tool to locate and point out those price levels where there is a congestion of indicators, moving averages, Fibonacci levels, Pivot Points, etc. Knowing where these congestion points are located is very useful for the trader, and can be used as a basis for different strategies.

This tool assigns a certain amount of “weight” to each indicator, and this “weight” can influence adjacents price levels. This means that one price level without any indicator or moving average but under the influence of two “strongly weighted” levels accumulate more resistance than their neighbors. In these cases, the tool signals resistance in apparently empty areas.

Learn more about Technical Confluence

Information on these pages contains forward-looking statements that involve risks and uncertainties. Markets and instruments profiled on this page are for informational purposes only and should not in any way come across as a recommendation to buy or sell in these assets. You should do your own thorough research before making any investment decisions. FXStreet does not in any way guarantee that this information is free from mistakes, errors, or material misstatements. It also does not guarantee that this information is of a timely nature. Investing in Open Markets involves a great deal of risk, including the loss of all or a portion of your investment, as well as emotional distress. All risks, losses and costs associated with investing, including total loss of principal, are your responsibility. The views and opinions expressed in this article are those of the authors and do not necessarily reflect the official policy or position of FXStreet nor its advertisers. The author will not be held responsible for information that is found at the end of links posted on this page.

If not otherwise explicitly mentioned in the body of the article, at the time of writing, the author has no position in any stock mentioned in this article and no business relationship with any company mentioned. The author has not received compensation for writing this article, other than from FXStreet.

FXStreet and the author do not provide personalized recommendations. The author makes no representations as to the accuracy, completeness, or suitability of this information. FXStreet and the author will not be liable for any errors, omissions or any losses, injuries or damages arising from this information and its display or use. Errors and omissions excepted.

The author and FXStreet are not registered investment advisors and nothing in this article is intended to be investment advice.

Recommended Content


Recommended Content

Editors’ Picks

EUR/USD trades with negative bias, holds above 1.0700 as traders await US PCE Price Index

EUR/USD trades with negative bias, holds above 1.0700 as traders await US PCE Price Index

EUR/USD edges lower during the Asian session on Friday and moves away from a two-week high, around the 1.0740 area touched the previous day. Spot prices trade around the 1.0725-1.0720 region and remain at the mercy of the US Dollar price dynamics ahead of the crucial US data.

EUR/USD News

USD/JPY jumps above 156.00 on BoJ's steady policy

USD/JPY jumps above 156.00 on BoJ's steady policy

USD/JPY has come under intense buying pressure, surging past 156.00 after the Bank of Japan kept the key rate unchanged but tweaked its policy statement. The BoJ maintained its fiscal year 2024 and 2025 core inflation forecasts, disappointing the Japanese Yen buyers. 

USD/JPY News

Gold price flatlines as traders look to US PCE Price Index for some meaningful impetus

Gold price flatlines as traders look to US PCE Price Index for some meaningful impetus

Gold price lacks any firm intraday direction and is influenced by a combination of diverging forces. The weaker US GDP print and a rise in US inflation benefit the metal amid subdued USD demand. Hawkish Fed expectations cap the upside as traders await the release of the US PCE Price Index.

Gold News

Sei Price Prediction: SEI is in the zone of interest after a 10% leap

Sei Price Prediction: SEI is in the zone of interest after a 10% leap

Sei price has been in recovery mode for almost ten days now, following a fall of almost 65% beginning in mid-March. While the SEI bulls continue to show strength, the uptrend could prove premature as massive bearish sentiment hovers above the altcoin’s price.

Read more

US core PCE inflation set to signal firm price pressures as markets delay Federal Reserve rate cut bets

US core PCE inflation set to signal firm price pressures as markets delay Federal Reserve rate cut bets

The core PCE Price Index, which excludes volatile food and energy prices, is seen as the more influential measure of inflation in terms of Fed positioning. The index is forecast to rise 0.3% on a monthly basis in March, matching February’s increase. 

Read more

Majors

Cryptocurrencies

Signatures