|

GBP/USD has its battle lines clearly drawn on Super Thursday — Confluence Detector

The GBP/USD is waiting anxiously for the all-important Super Thursday decision by the Bank of England. Will they send Sterling higher or lower? 

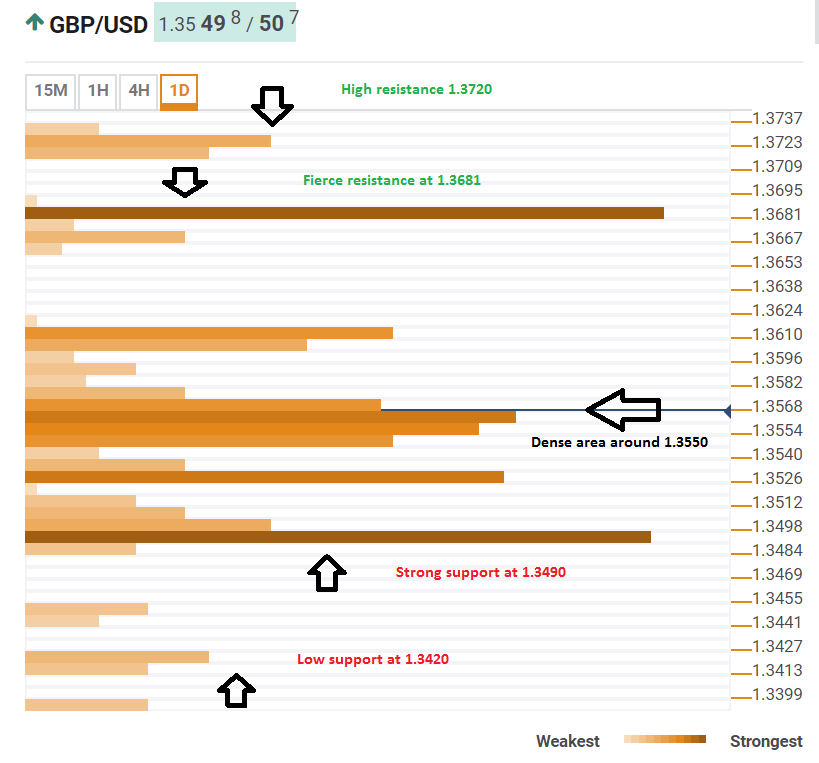
The Technical Confluences Indicator shows that dense clusters of support and resistance await the pair. On the topside, $1.3681 is the convergence of the Fibonacci 161.8% one-day, the Fibonacci 61.8% one-week and the Simple Moving Average 10 one day, all potent levels.

On the downside, the $1.3490 level is the confluence of the Pivot Point one-day Support 1, the one-month low, the and the one-week low, also three very substantial levels. 

And there are good reasons why the pair is clinging to the $1.3550 region. There is a congestion of many lines there: the SMA 5-1d, the SMA50-15m, the SMA100-15m, the SMA10-1h, the Bolinger Band 15m-Lower, the Fibonacci 23.6% one-week, the Bolinger Band one-hour-Middle, the SMA100 one hour, and the Simple Moving Average10-4h. 

If Sterling shines, high resistance is at $1.3720 where the Pivot Point one-week awaits. If the Pound plummets, low support is at $1.3420

Here is how it looks on the tool:

GBP USD technical confluence May 10 2018

Confluence Detector

The Confluence Detector finds exciting opportunities using Technical Confluences. The TC is a tool to locate and point out those price levels where there is a congestion of indicators, moving averages, Fibonacci levels, Pivot Points, etc. Knowing where these congestion points are located is very useful for the trader, and can be used as a basis for different strategies.

This tool assigns a certain amount of “weight” to each indicator, and this “weight” can influence adjacents price levels. This means that one price level without any indicator or moving average but under the influence of two “strongly weighted” levels accumulate more resistance than their neighbors. In these cases, the tool signals resistance in apparently empty areas.

Learn more about Technical Confluence

Author

Yohay Elam

Yohay Elam

FXStreet

Yohay is in Forex since 2008 when he founded Forex Crunch, a blog crafted in his free time that turned into a fully-fledged currency website later sold to Finixio.

More from Yohay Elam
Share:

Editor's Picks

AUD/USD falls to near 0.7100 after slipping below 50-day EMA

AUD/USD depreciates after registering minor gains in the previous day, trading around 0.7120 during the Asian hours. The technical analysis of the daily chart shows the pair consolidating sideways within a rectangle pattern, as neither bulls nor bears gain control. The AUD/USD pair is holding a slight bearish tone however as it sits beneath both the nine-day and 50-day EMAs.

160.00: USD/JPY back near intervention territory after upbeat US jobs report

US Nonfarm Payrolls beat expectations by a wide margin in May, with 172K jobs added. The US Dollar rebounds after the release, helping USD/JPY recover from its intraday lows. Warnings from Japanese authorities continue to limit upside potential near the 160.00 threshold.

Gold targets $4,300 amid stronger Dollar

Gold faces increasing selling interest and navigates the area of three-month lows near the $4,300 mark per troy ounce on Friday. The precious metal’s decline comes as traders assess the stronger-than-expected NFP, while the bid bias in the Greenback and higher US Treasury yields also collaborate with the retracement.

Cardano hits five-year low even as Hoskinson clarifies "break" isn't an exit

Cardano (ADA) price is down 10% at press time on Friday, extending losses over 30% so far this week amid Charles Hoskinson's clarification that "break" isn't an exit.

Week ahead – Fed countdown begins amid US inflation data and geopolitical risks

Fed Chair Warsh’s first meeting approaches as key US inflation data could reshape expectations. Oil prices remain elevated as US-Iran talks continue; tariffs also return to the spotlight. ECB is expected to hike; will it be a one-off move or is July live?

The US economy defies the rules: 100 days into the Oil shock and the recession signal is still missing

More than three months after the start of the Iran war and the resulting disruption to global energy markets, the US economy continues to display remarkable resilience. The conflict has triggered a sharp rise in Oil prices, reignited inflationary pressures and fueled widespread concerns about a potential economic slowdown.