|

GBP/USD gains some confidence for new higher high [Video]

  • GBPUSD returns above key support trendline, reduces negative risks.

  • Technical signals are encouraging for a continuation to 1.2850-1.2900.

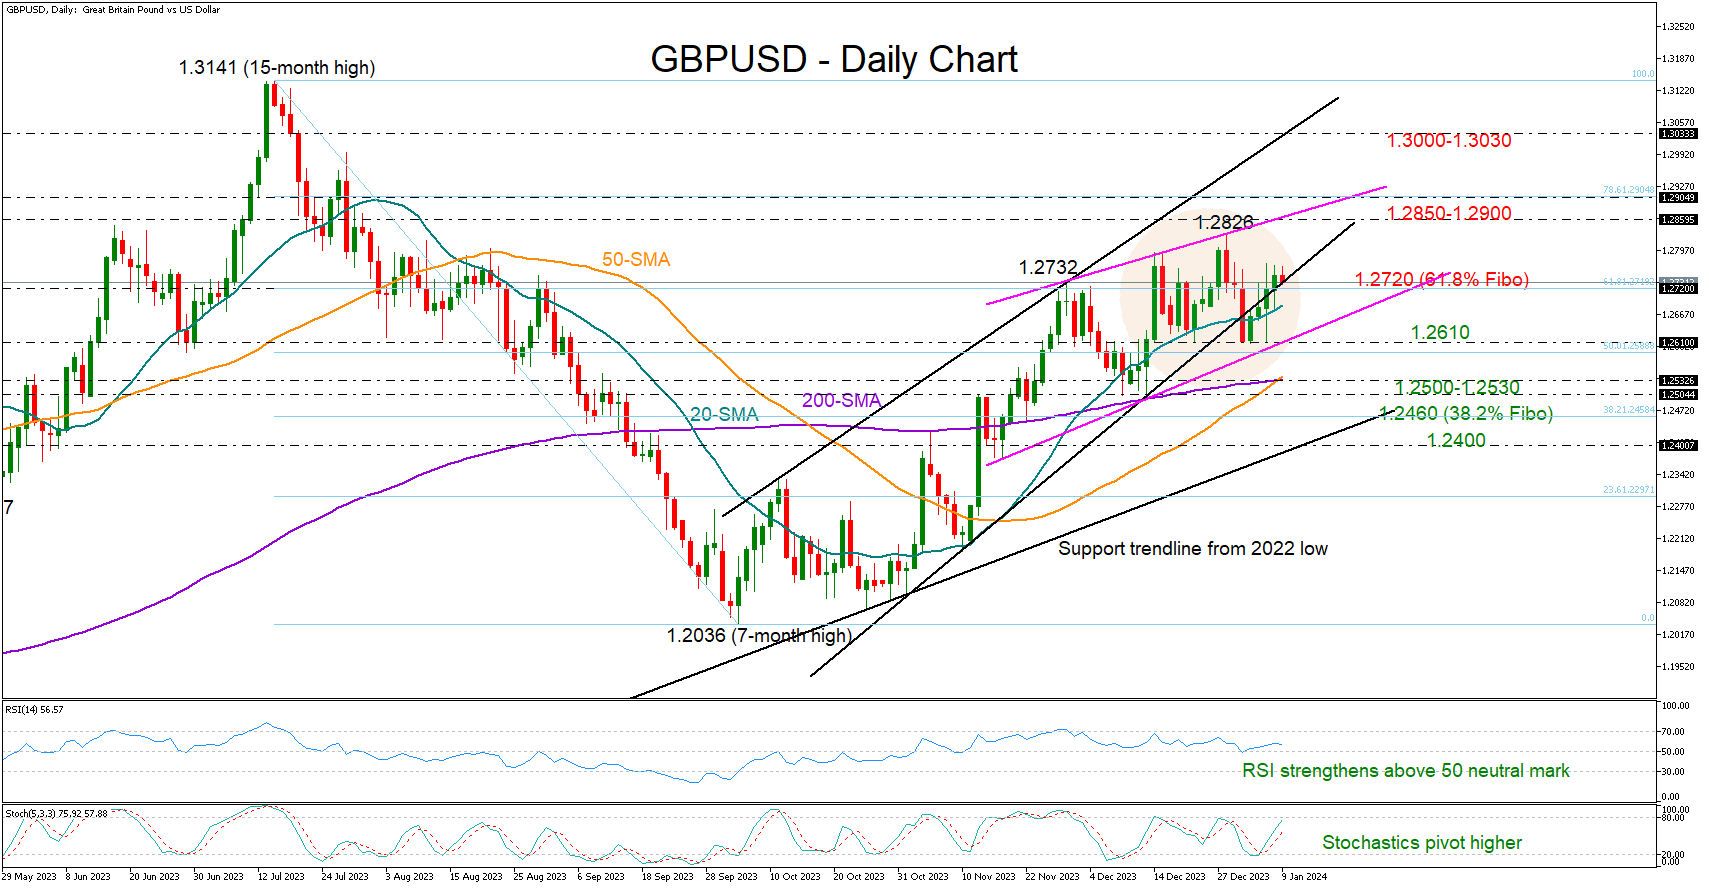
GBPUSD stepped on the 20-day simple moving average (SMA) and climbed back above the broken short-term support trendline from October at 1.2720, reviving hopes that the soft four-day bullish wave could gain extra legs in the coming sessions.

The positive trajectory in the RSI and the stochastic oscillator is endorsing the bullish case, increasing the odds for a bounce towards the 1.2850-1.2900 resistance region. Note that the short-term ascending line from November 2023 is passing through this area. Hence, a decisive close above it could encourage a direct flight towards the 1.3000 psychological mark and the tentative ascending line, which connects the highs from October and November.

On the downside, the 20-day SMA will remain under the spotlight at 1.2686. A break below that line is expected to see a test near the crucial floor of 1.2610. If the bears drive below that base, confirming a negative head and shoulders pattern, the price could tumble towards its 50- and 200-day SMAs, which are currently trying to complete a golden cross around 1.2532. Additional declines from there might last till the 2020 upward-sloping trendline at 1.2400, unless the 1.2460 barrier blocks the way down.

All in all, GBPUSD has restored some optimism in the short-term picture after the close above the 1.2720 bar. Overall, the outlook may not deteriorate unless the 1.2610 floor cracks.   

GBPUSD

Author

Christina Parthenidou

Christina joined the XM investment research department in May 2017. She holds a master degree in Economics and Business from the Erasmus University Rotterdam with a specialization in International economics.

More from Christina Parthenidou
Share:

Editor's Picks

AUD/USD falls to near 0.7100 after slipping below 50-day EMA

AUD/USD depreciates after registering minor gains in the previous day, trading around 0.7120 during the Asian hours. The technical analysis of the daily chart shows the pair consolidating sideways within a rectangle pattern, as neither bulls nor bears gain control. The AUD/USD pair is holding a slight bearish tone however as it sits beneath both the nine-day and 50-day EMAs.

160.00: USD/JPY back near intervention territory after upbeat US jobs report

US Nonfarm Payrolls beat expectations by a wide margin in May, with 172K jobs added. The US Dollar rebounds after the release, helping USD/JPY recover from its intraday lows. Warnings from Japanese authorities continue to limit upside potential near the 160.00 threshold.

Gold targets $4,300 amid stronger Dollar

Gold faces increasing selling interest and navigates the area of three-month lows near the $4,300 mark per troy ounce on Friday. The precious metal’s decline comes as traders assess the stronger-than-expected NFP, while the bid bias in the Greenback and higher US Treasury yields also collaborate with the retracement.

Cardano hits five-year low even as Hoskinson clarifies "break" isn't an exit

Cardano (ADA) price is down 10% at press time on Friday, extending losses over 30% so far this week amid Charles Hoskinson's clarification that "break" isn't an exit.

Week ahead – Fed countdown begins amid US inflation data and geopolitical risks

Fed Chair Warsh’s first meeting approaches as key US inflation data could reshape expectations. Oil prices remain elevated as US-Iran talks continue; tariffs also return to the spotlight. ECB is expected to hike; will it be a one-off move or is July live?

The US economy defies the rules: 100 days into the Oil shock and the recession signal is still missing

More than three months after the start of the Iran war and the resulting disruption to global energy markets, the US economy continues to display remarkable resilience. The conflict has triggered a sharp rise in Oil prices, reignited inflationary pressures and fueled widespread concerns about a potential economic slowdown.