GBP/USD Forecast: Pound Sterling to face stiff resistance at 1.2450
- GBP/USD has gained traction, cllimbing above 1.2400 early Tuesday.
- The pair's near-term technical outlook points to a bullish tilt.
- The 1.2450 level aligns as key resistance for the pair.

Following a quiet Asian session, GBP/USD has turned north and climbed above 1.2400 in the early European trading hours on Tuesday. The pair's near-term technical outlook highlights a build-up of bullish momentum, but buyers could find it difficult to clear the 1.2450 resistance.
The positive shift seen in risk sentiment following the long-weekend in the US doesn't allow the US Dollar (USD) to extend its rally and helps GBP/USD stretch higher. The US Dollar Index, which tracks the USD's performance against a basket of six major currencies, retreats toward 104.00 from the multi-month high it set above 104.50 earlier in the day.
Reflecting the upbeat mood, US stock index futures rise between 0.3% and 1.1%. Later in the day, the House Rules Committee is expected to vote on the 99-page bill that US President Joe Biden and House Speaker Kevin McCarthy agreed on to suspend the debt ceiling. The bill is anticipated to move to the House for a vote on Wednesday.
If Wall Street's main indexes stage a risk rally after the opening bell, GBP/USD could preserve its bullish momentum and vice versa.
In the meantime, hawkish Bank of England (BoE) bets following the stronger-than-expected UK inflation data provide an additional boost to Pound Sterling. In a recently published report, economists at Nomura noted that they expect the BoE to raise the policy rate three more times this year and reach a terminal rate of 5.25%.
GBP/USD Technical Analysis
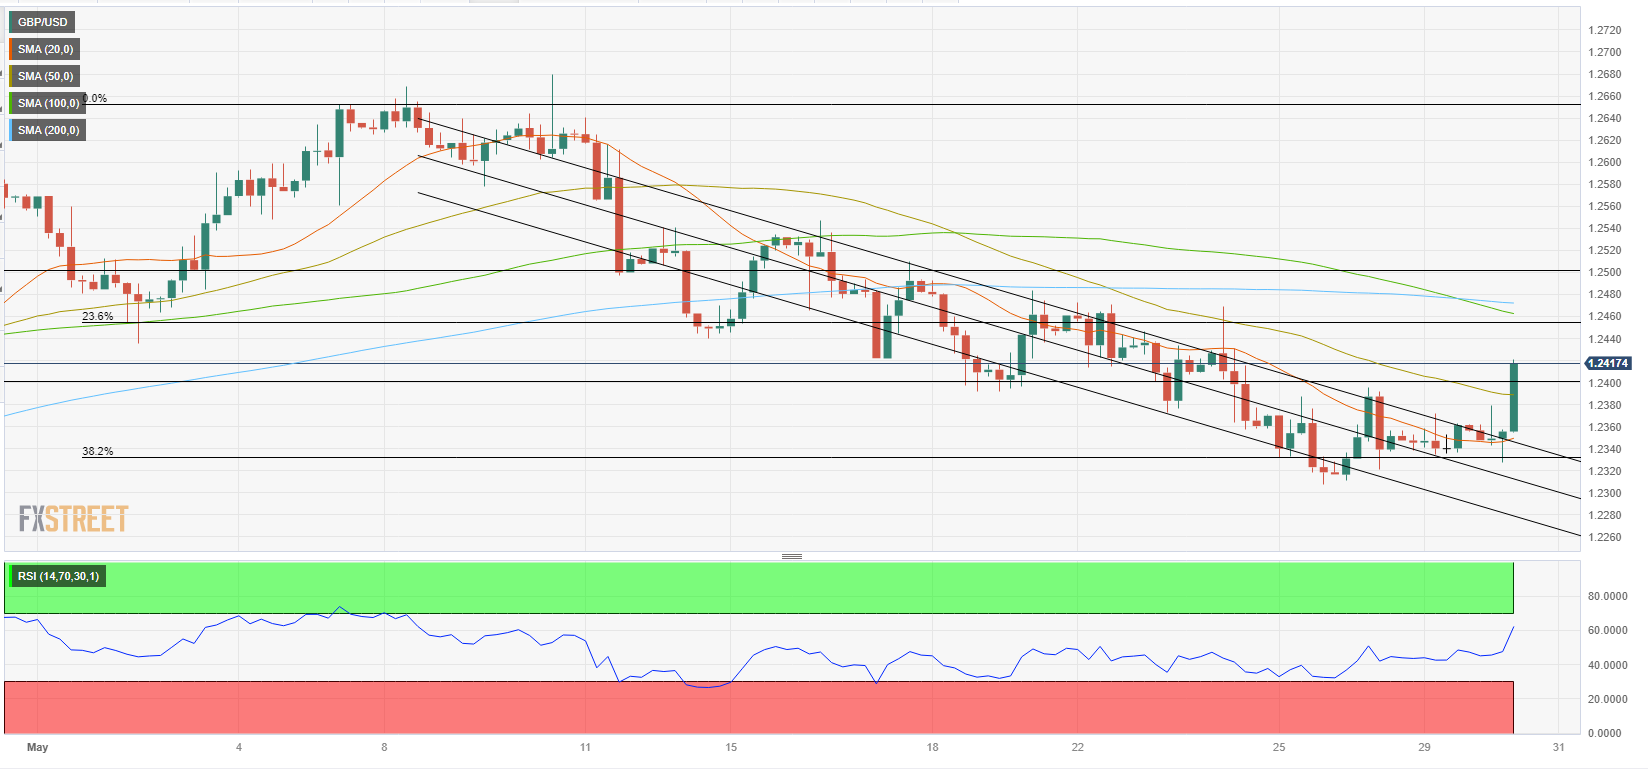
GBP/USD broke out of the descending regression channel and the Relative Strength Index (RSI) indicator on the four-hour chart climbed to 60, reflecting the bullish shift in the short-term outlook. On the upside, 1.2450/1.2460 (Fibonacci 23.6% retracement of the latest uptrend, 100-period Simple Moving Average (SMA), 200-period SMA) aligns as key resistance. In case the pair manages to flip that area into support, it could target 1.2500 (psychological level, static level) next.
First support is located at 1.2400/1.2390 (static level, 50-period SMA) ahead of 1.2350 (upper limit of the descending regression channel). A daily close below the latter could attract sellers and cause GBP/USD to extend its slide toward 1.2300 (psychological level, mid-point of the descending channel).
Premium
You have reached your limit of 3 free articles for this month.
Start your subscription and get access to all our original articles.
Author

Eren Sengezer
FXStreet
As an economist at heart, Eren Sengezer specializes in the assessment of the short-term and long-term impacts of macroeconomic data, central bank policies and political developments on financial assets.


