GBP/USD Forecast: Pound Sterling struggles to clear strong resistance
- GBP/USD trades in a narrow band above 1.2950 in the European morning on Monday.
- The 100-day SMA aligns as a pivot level at 1.2970.
- The near-term technical outlook shows that sellers hesitate to bet on an extended decline.

After rising toward 1.3000 on Friday, GBP/USD lost its traction and closed the day marginally lower. The pair stays relatively quiet and moves sideways above 1.2950 in the European morning on Monday.
British Pound PRICE Last 7 days
The table below shows the percentage change of British Pound (GBP) against listed major currencies last 7 days. British Pound was the weakest against the US Dollar.
| USD | EUR | GBP | JPY | CAD | AUD | NZD | CHF | |
|---|---|---|---|---|---|---|---|---|
| USD | 0.58% | 0.64% | 2.51% | 0.55% | 1.60% | 1.59% | 0.42% | |
| EUR | -0.58% | -0.01% | 1.84% | 0.02% | 0.99% | 0.90% | -0.22% | |
| GBP | -0.64% | 0.01% | 1.83% | -0.09% | 0.97% | 0.94% | -0.27% | |
| JPY | -2.51% | -1.84% | -1.83% | -1.92% | -0.88% | -0.85% | -2.10% | |
| CAD | -0.55% | -0.02% | 0.09% | 1.92% | 0.96% | 1.08% | -0.24% | |
| AUD | -1.60% | -0.99% | -0.97% | 0.88% | -0.96% | 0.06% | -1.24% | |
| NZD | -1.59% | -0.90% | -0.94% | 0.85% | -1.08% | -0.06% | -1.20% | |
| CHF | -0.42% | 0.22% | 0.27% | 2.10% | 0.24% | 1.24% | 1.20% |
The heat map shows percentage changes of major currencies against each other. The base currency is picked from the left column, while the quote currency is picked from the top row. For example, if you pick the British Pound from the left column and move along the horizontal line to the US Dollar, the percentage change displayed in the box will represent GBP (base)/USD (quote).
Although the upbeat market mood helped GBP/USD hold its ground in the European trading hours on Friday, rising US Treasury bond yields supported the US Dollar heading into the weekend, causing the pair to reverse its direction.
In the absence of high-impact macroeconomic data releases and fundamental drivers, GBP/USD could react to changes in the risk perception on Monday. At the time of press, US Stock index futures were rising between 0.5% and 0.7%. In case risk flows dominate the action in financial markets after Wall Street's opening bell, the USD could come under renewed selling pressure.
On Wednesday, the UK government will present the Autumn Budget. The US economic calendar will also feature key data releases in the second half of the week.
The US Bureau of Economic Analysis will publish the first estimate of the annualized Gross Domestic Product (GDP) growth for the third quarter on Wednesday and release the Personal Consumption Expenditures (PCE) Price Index figures for September on Thursday. Finally, the US Bureau of Labor Statistics will release the labor market data for October on Friday.
GBP/USD Technical Analysis
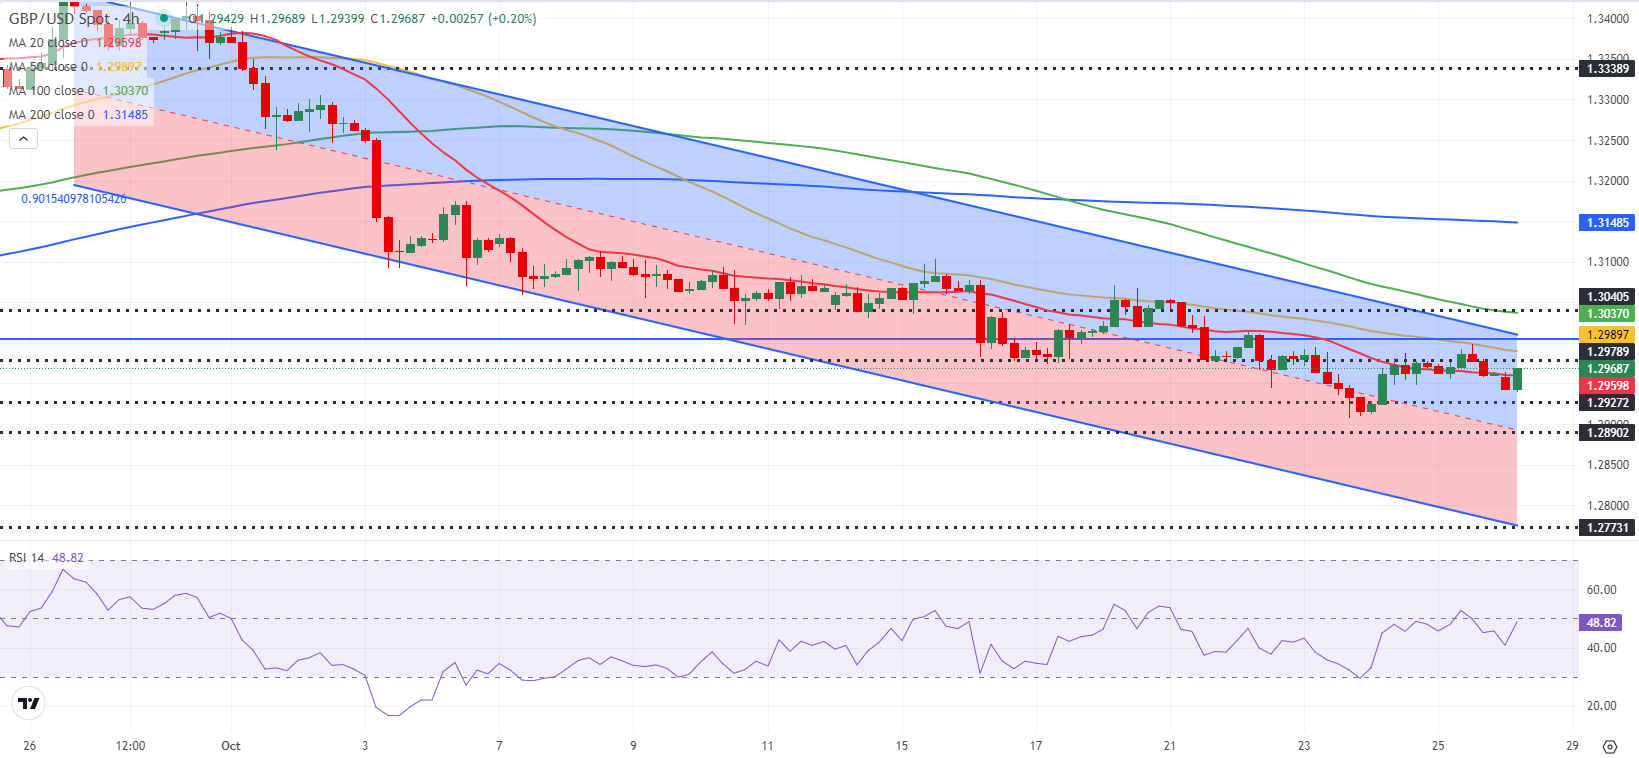
The Relative Strength Index (RSI) indicator on the 4-hour chart rises toward 50, pointing to a loss of bearish momentum. On the upside, the 100-day Simple Moving Average (SMA) aligns as immediate resistance at 1.2970. In case the pair makes a daily close above this level, it could attract technical buyers. In this scenario, 1.3010 (upper limit of the descending channel) could be seen as next resistance before 1.3060 (20-day SMA).
Looking south, first support could be spotted at 1.2900-1.2890 (round level, mid-point of the descending channel) before 1.2800 (round level, static level).
Pound Sterling FAQs
The Pound Sterling (GBP) is the oldest currency in the world (886 AD) and the official currency of the United Kingdom. It is the fourth most traded unit for foreign exchange (FX) in the world, accounting for 12% of all transactions, averaging $630 billion a day, according to 2022 data. Its key trading pairs are GBP/USD, also known as ‘Cable’, which accounts for 11% of FX, GBP/JPY, or the ‘Dragon’ as it is known by traders (3%), and EUR/GBP (2%). The Pound Sterling is issued by the Bank of England (BoE).
The single most important factor influencing the value of the Pound Sterling is monetary policy decided by the Bank of England. The BoE bases its decisions on whether it has achieved its primary goal of “price stability” – a steady inflation rate of around 2%. Its primary tool for achieving this is the adjustment of interest rates. When inflation is too high, the BoE will try to rein it in by raising interest rates, making it more expensive for people and businesses to access credit. This is generally positive for GBP, as higher interest rates make the UK a more attractive place for global investors to park their money. When inflation falls too low it is a sign economic growth is slowing. In this scenario, the BoE will consider lowering interest rates to cheapen credit so businesses will borrow more to invest in growth-generating projects.
Data releases gauge the health of the economy and can impact the value of the Pound Sterling. Indicators such as GDP, Manufacturing and Services PMIs, and employment can all influence the direction of the GBP. A strong economy is good for Sterling. Not only does it attract more foreign investment but it may encourage the BoE to put up interest rates, which will directly strengthen GBP. Otherwise, if economic data is weak, the Pound Sterling is likely to fall.
Another significant data release for the Pound Sterling is the Trade Balance. This indicator measures the difference between what a country earns from its exports and what it spends on imports over a given period. If a country produces highly sought-after exports, its currency will benefit purely from the extra demand created from foreign buyers seeking to purchase these goods. Therefore, a positive net Trade Balance strengthens a currency and vice versa for a negative balance.
Author

Eren Sengezer
FXStreet
As an economist at heart, Eren Sengezer specializes in the assessment of the short-term and long-term impacts of macroeconomic data, central bank policies and political developments on financial assets.


