Is the Gold-Silver ratio still relevant today?

Earlier this week, I wrote that the gold-silver ratio has recently widened to around 70-1, a bullish signal for silver.
But is this metric still relevant today?
Many analysts say it isn’t, claiming that the ratio is a relic of a bygone era when gold and silver were both integral to the global financial system. They argue that the gold-silver ratio reveals little about the markets in this modern era.
However, a report by the Silver Institute finds that the gold-silver ratio may be more relevant than ever. In fact, its statistical analysis shows “the price correlation between the two precious metals has actually strengthened over the past two decades as gold and silver markets have become increasingly financialized.”
The history of the Gold Silver ratio?
The gold-silver ratio tells you how many ounces of silver it takes to buy one ounce of gold given the current spot price of both metals. In other words, it tells you the price of gold in ounces of silver.
Since gold and silver tend to move together, their price relationship has historically helped technical analysts anticipate price moves.
From a historical perspective, when you see gold-silver ratios well above their historical average, it tells you that silver is underpriced compared to gold, and there is a strong possibility that silver will go on a bull run to close that gap.
Between around 3,000 BC and the 1800s, the gold-silver ratio was an extremely important market signal. So much so that the Silver Institute called it “arguably the single most important financial indicator.”
When both silver and gold were integral in the monetary systems, governments often set the gold-silver ratio by fiat. The earliest recorded imposed gold-silver ratio was by King Menes of Ancient Egypt at 2.5-1.
Rome set a gold-silver ratio of 8-1 in the early years of the empire in 210 BCE. As gold and silver flowed into Rome through its conquests, the ratio fluctuated, rising as high as 12-1. Julius Caesar established a gold-silver ratio of 11.5-1, and Augustus bumped it up to 11.75-1.
A bi-metallic monetary system proved to be unwieldy, and European countries began to demonetize silver in the mid-19th century. The U.S. followed the lead of England, Portugal, Germany, and other nations and established a gold standard in the Coinage Act of 1873.
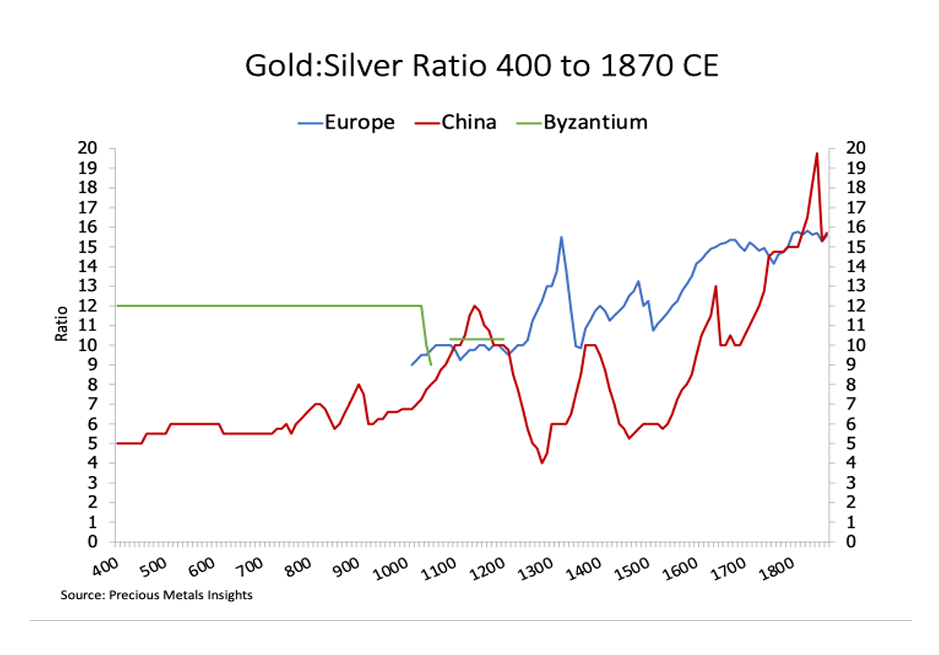
The demonetization left the gold-silver ratio to float freely. By World War II, the average gold-silver ratio had spread to as much as 40-1.
Does the Gold-Silver ratio still hold?
In the modern era, the gold-silver ratio has averaged between 40-1 and 60-1.
While some argue that the ratio is breaking down, the two metals still maintain that relationship today, according to the Silver Institute report.
"The gold-silver ratio is not a 'random walk' but mean-reverting. A Johansen Cointegration Test on the data from January 1970 to May 2026 generated a long-run equilibrium for the ratio of 59.65. Periods of disequilibrium therefore indicate over- or undervaluation of gold or silver. Moreover, despite the massive inflation in the price scales for these precious metals over the past 56 years, the core gold-silver relationship is still bound to a central axis."
In other words, the average gold-silver ratio is still at around 60-1, and deviations from that level reflect dislocation in one or both of the markets.
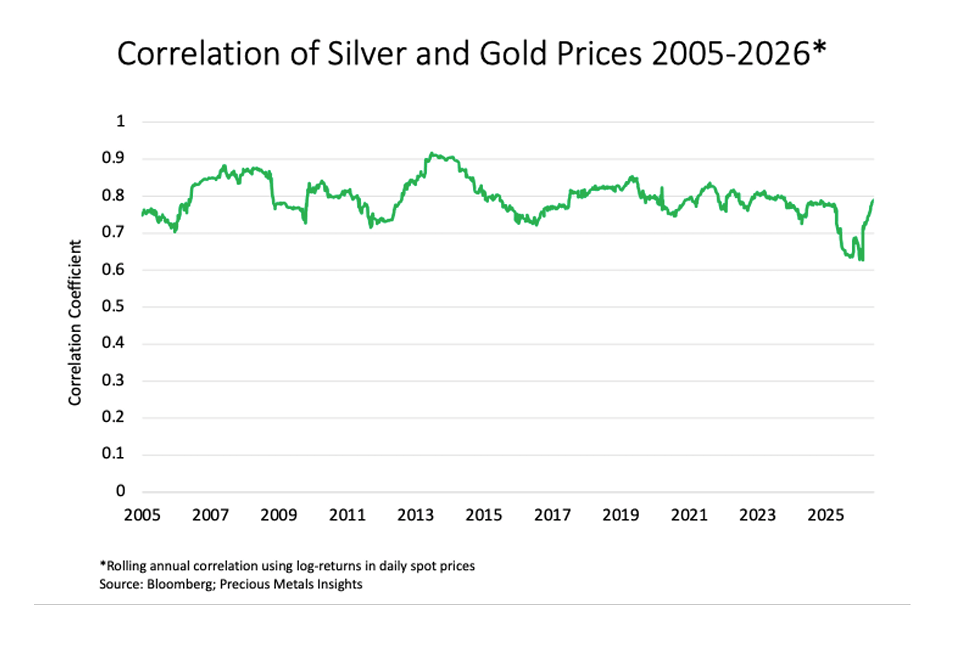
As the Silver Institute summarized it, “Periods of extreme market disequilibrium serve as clear signals of major over- or undervaluation in either gold or silver, rather than a permanent structural break.”
Shorter-run changes in relative supply and demand of gold and silver systematically drive the ratio in and out of equilibrium.
Over the last 20 years, we have seen the gold-silver ratio widen and then snap back to the mean several times. The closing of the ratio has typically occurred during a gold bull market when silver outperforms the yellow metal.
For instance, the gold-silver ratio fell to 30-1 in 2011 after rising to over 80-1 during the money creation of the Great Recession in the wake of the 2008 financial crisis.
Then in 2020, the gold-silver ratio set a record of 123-1 as Covid hysteria gripped the world and then plunged to around 60-1 as central banks around the world cranked up the money creation machine to cope with governments shutting down economies.
Most recently, the ratio ran between 80-1 and 100-1 in the months before the October ’25 price rally, briefly eclipsing 100-1 in March 2025. At the time, I wrote that the wide ratio signaled significant upside for silver and forecast that the price would ultimately rise to close the gap. Sure enough, as silver spiked in January, the gold-silver ratio plunged to 43-1, at the low end of the historical average.
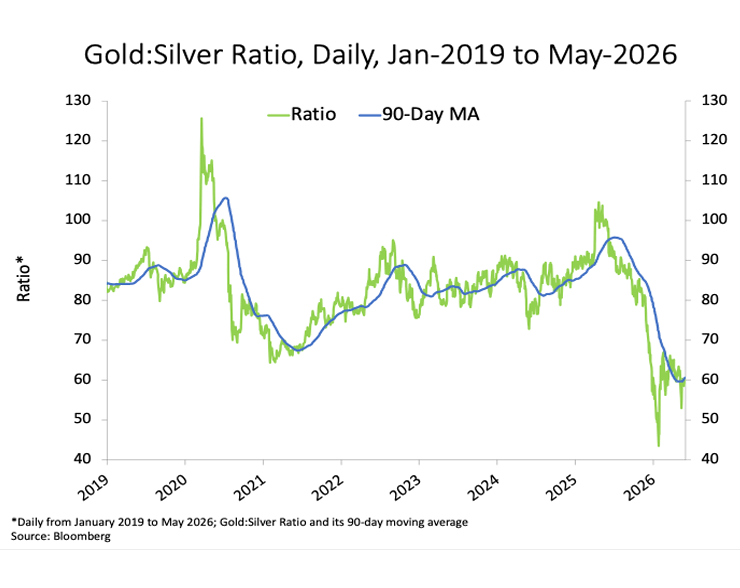
So, the gold-silver ratio continues to serve as an excellent tool for technical analysis. As the Silver Institute report shows, it is every bit as relevant today, even though silver is no longer formally used in the global financial system.
“While the demise of formal bimetallic, silver and gold monetary standards over more than a century through to 1971 structurally shifted the baseline ratio, the structural relationship between gold and silver has continued into the modern era.”
When you see a wide gold-silver ratio, it signals silver is on sale compared to gold. Gold will either have to fall to close the gap, or silver will have to rally. Historically, it has been a silver rally closing the gap.
To receive free commentary and analysis on the gold and silver markets, click here to be added to the Money Metals news service.
Author

Mike Maharrey
Money Metals Exchange
Mike Maharrey is a journalist and market analyst for MoneyMetals.com with over a decade of experience in precious metals. He holds a BS in accounting from the University of Kentucky and a BA in journalism from the University of South Florida.

















